Volatility Is Normal
- March 23, 2020
Stay Invested for the Long Run
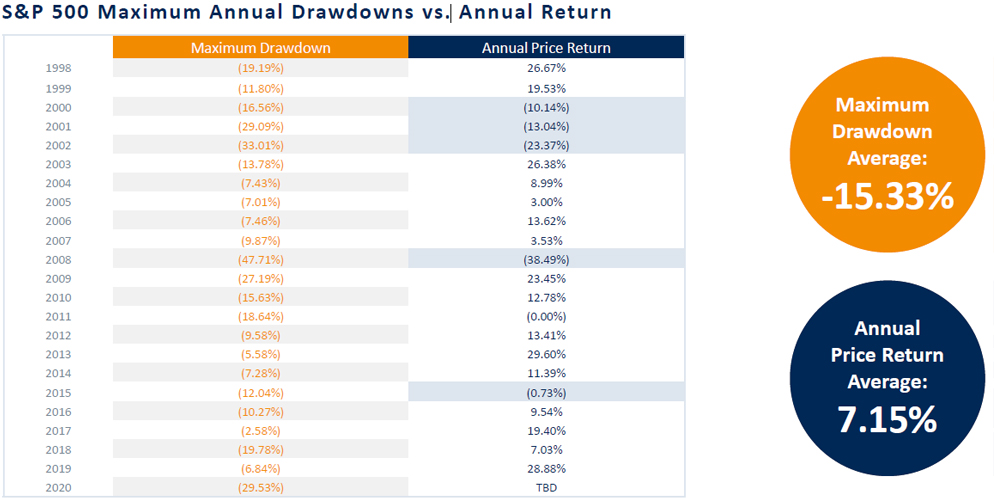
Healthy markets experience sizeable selloffs. In 20 of the last 21 years, the stock market saw a pullback of 7% or higher. Yet only five of those years saw a negative annual price return. Investors tend to get hurt when they lose sight of the big picture or can’t stomach short-term volatility. Generally, staying invested for the long run has proven to be a better strategy than trying to time the market. Indeed, behavioral finance research shows that many investors tend to buy high and sell low, which could sink their portfolios.

The Upshot: Missing the market's best days is far worse than being invested during its worst. Keep calm through periods of volatility and consult with your financial advisor on how to dampen the effects of volatility while staying on track to hit your long-term goals.
If you’re not a client and want to learn more about the effects of volatility on your portfolio, reach out to an Oppenheimer Financial Advisor.
Disclosures
Data as 3/19/2020. Sources: FactSet and OAM Research. This chart contains historical data and it is used for illustrative purposes only. It doesn't constitute investment advice and it's not an investment recommendation. There is no guarantee that any investment strategy will be successful. Investing in securities involves risk and may result in loss of principal. Past performance is no guarantee of future results. Indices are unmanaged, hypothetical portfolios of securities that are often used as a benchmark in evaluating the relative performance of a particular investment. An index should only be compared with a mandate that has a similar investment objective. An index is not available for direct investment, and does not reflect any of the costs associated with buying and selling individual securities or management fees. The S&P 500 Index consists of 500 stocks chosen for market size, liquidity, and industry group representation. It is a market value weighted Index (stock price times number of shares outstanding), with each stock's weight in the Index proportionate to its market value. The index is one of the most widely used benchmarks of US Equity Large Cap performance. 2302945.2