Mind the Valuation Gap
- August 6, 2020
A look at current P/E ratios of growth and value stocks compared to historical averages.
Throughout history, growth and value investment styles have cycled in and out of favor. That ebb and flow has been driven by economic activity, company growth rates, the market outlook and a series of other factors. Investors should pay attention to the valuation gap between growth and value styles and look for attractive opportunities to strengthen portfolios.
Growth Spurt
Growth stock valuations, which were about half of their value counterparts during the 2008 financial crisis, have steadily climbed for the past 11 years. Today, growth trades at a premium not seen since the tech bubble.
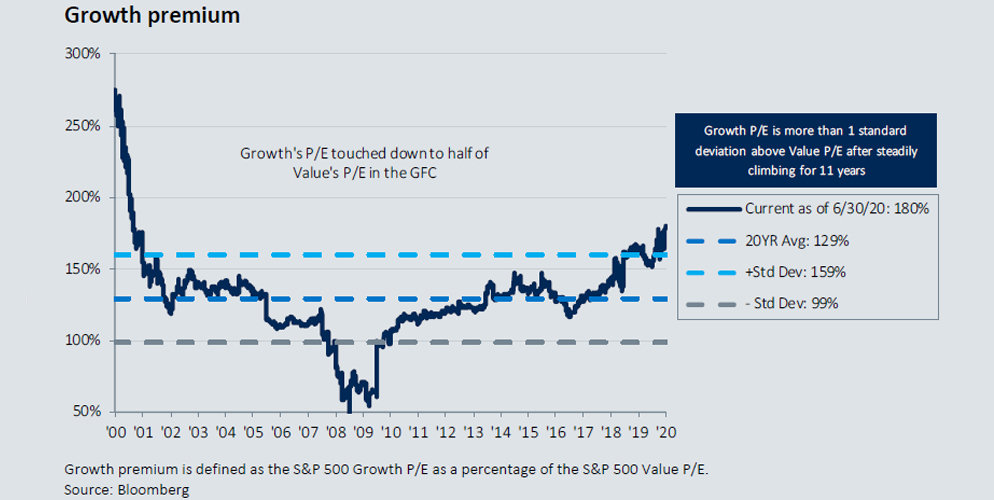
The valuation gap between growth and value has widened considerably. The S&P 500 Growth Index is trading at an 80% premium to the S&P 500 Value Index compared to an average premium of 29% over the past 20 years. This growth premium is even more pronounced in the Russell 1000 and Russell Mid Cap Indexes. When looking at trailing P/E ratios, the Russell 1000 Growth Index is trading at an 110% premium to the Russell 1000 Value Index and has averaged a 38% premium over the past 20 years. The Russell Mid Cap Growth Index is trading at a 210% premium to the Russell Mid Cap Value and has averaged 70% over the past 20 years.
A Small Discount
Value stocks are trading at a discount to their growth counterparts, with small-cap value offering the largest discount.
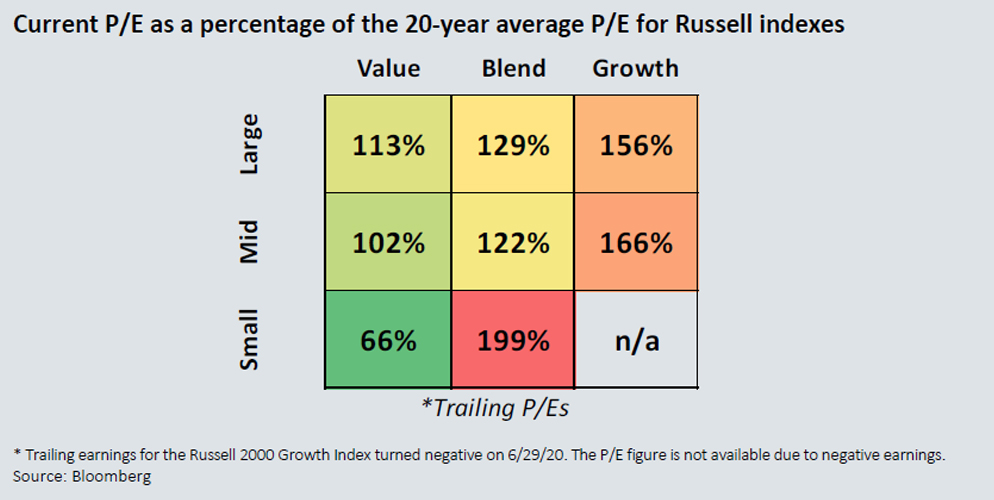
Small-cap value stocks are trading at the highest discount. Right now, value indexes are trading at significant discounts to their blend and growth counterparts when comparing current index P/E ratios to their 20-year average trailing P/E ratios as of June 30, 2020. According to this metric, small-cap value stocks are offering the largest discount, followed by mid-cap value and large-cap value. Small-cap growth stocks are the most overpriced.
Mind the gap and look for opportunities to rebalance. When style valuations approach bubble territory, active managers rebalance their portfolios to take advantage of attractive prices in beaten-up stocks and mitigate the downside risk of mean reversion in styles that are in favor. Similarly, investors can evaluate their asset allocation mix to uncover areas that might be too richly valued and worth rebalancing.
DISCLOSURE
This material is intended for informational purposes only. The information and statistical data contained herein have been obtained from sources we believe to be reliable. Oppenheimer Investment Advisers (OIA) is a division of Oppenheimer Asset Management Inc. Oppenheimer Investment Management is a subsidiary of Oppenheimer Asset Management. The opinions expressed are those of Oppenheimer Asset Management Inc.(“OAM”) and its affiliates and are subject to change without notice. No part of this material may be reproduced in any manner without the written permission of OAM or any of its affiliates. Any securities discussed should not be construed as a recommendation to buy or sell and there is no guarantee that these securities will be held for a client’s account nor should it be assumed that they were or will be profitable. Securities referenced herein are used as proxies or illustrations of broader market or sector principles. Past performance does not guarantee future comparable results.
All securities investing entails some risk of loss of principal. There is no guarantee the recommended strategy will be successful. Oppenheimer Asset Management is the name under which Oppenheimer Asset Management Inc. (OAM) does business. OAM is a registered investment adviser. A strategy's performance may be affected by general economic and market conditions, such as interest rates, inflation rates, economic uncertainty, changes in laws, and national and international political circumstances. The information provided herein should not be construed as a recommendation to buy, sell, or hold any particular security. Opinions expressed herein are current as of the date appearing in this material.
OAM is a wholly owned subsidiary of Oppenheimer Holdings Inc. which also wholly owns Oppenheimer & Co. Inc. (“Oppenheimer”), a registered broker/dealer and investment adviser. Securities are offered through Oppenheimer and will not be insured by the FDIC or other similar deposit insurance, will not be deposits or other obligations of Oppenheimer or guaranteed by any bank or other financial institution, will not be endorsed or guaranteed by Oppenheimer and will be subject to investment risks, including the possible loss of principle invested. Indices are unmanaged, hypothetical portfolios of securities that are often used as a benchmark in evaluating the relative performance of a particular investment. An index should only be compared with a mandate that has a similar investment objective. An index is not available for direct investment, and does not reflect any of the costs associated with buying and selling individual securities or management fees. 3190425.1