Whiplash!
- August 20, 2020
Taxable Fixed Income
Leo Dierckman, Senior Portfolio Manager
Michael Richman, Senior Portfolio Manager
Portfolio managers Leo Dierckman and Michael Richman break down the extraordinary actions taken by the Federal Reserve and Congress to mitigate the economic damage of the pandemic and their implications for bond investors.
The coronavirus and its devastating toll on public health and the economy remained the theme in markets during the second quarter and we expect that to continue. On the economic front, actions by both the Federal Reserve and Congress led to a significantly improved investment environment. The liquidity scare and rush for cash in March has been largely alleviated. Asset prices have recovered significantly, volatility has lessened and markets are once again functioning with two-way trading. We believe the underlying economy is healing and that the recovery will take multiple years to return to pre-pandemic levels of employment and wage growth. The damage is deep and the post-pandemic economy will look much different than the one we knew.
Bond Market Overview
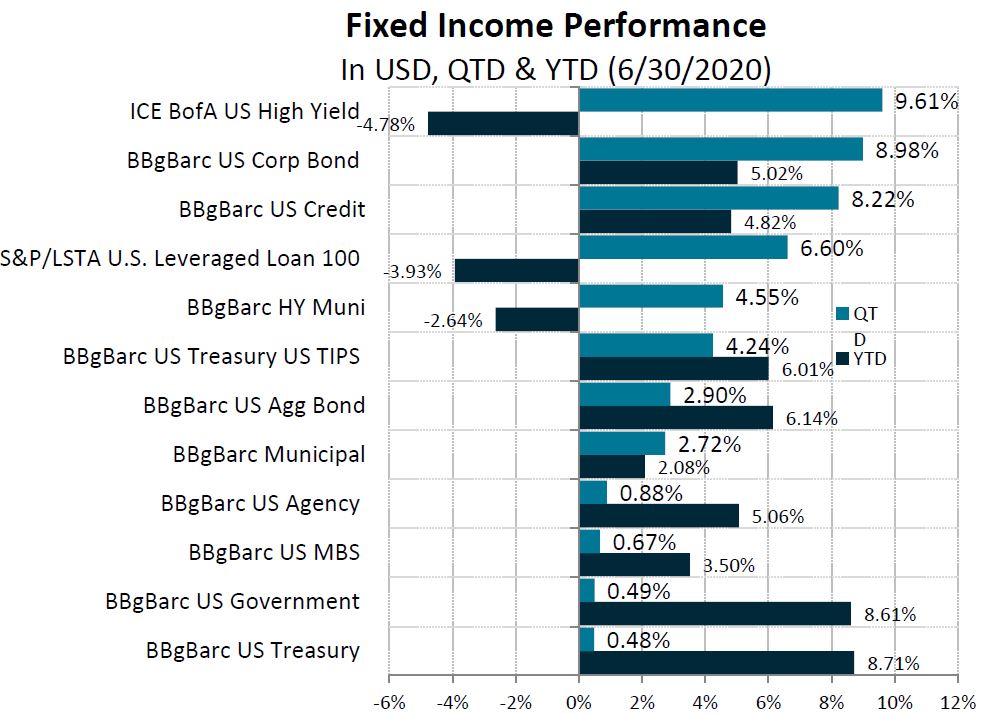
On the heels of one of the worst quarters in in history for U.S. corporate credit, returns bounced back in the second quarter. U.S. investment-grade corporate credit returned 8.98% and U.S. high yield was up 9.61%, resulting in first-half 2020 returns of 5.02% and -4.78%, respectively. While positive for the year, investment-grade corporates are still lagging Treasuries as interest rates declined significantly in the first quarter. Treasury returns were minimally positive in the second quarter. Municipal bonds lagged corporates on both a quarter-to-date and year-to-date basis, returning 2.72% and 2.08%, respectively. Loans returned 6.6% for the quarter, trailing U.S. high yield, but have outperformed high-yield bonds year-to-date, down 3.93%.

Liquidity Injection
In response to the Covid-19 economic shutdown, the Federal Reserve acted with speed and force to stabilize the financial system and ensure orderly banking and securities markets. Last quarter, we summarized the historic measures implemented by the Fed in response to the crisis. This quarter, we assess the effectiveness of each action to date.
Action: Rate cuts
Result: The Fed cut the federal funds target rate 0.50% on March 3 and 1% on March 15, reducing the rate to the lower bound (0% to 0.25%) almost immediately as the crisis unfolded. By lowering rates, the Fed reduces the cost of borrowing for banks and influences a number of short-term interest rates, including rates on deposits, bank loans, credit cards, and adjustable-rate mortgages. Lower rates encourage borrowing and investment while freeing up more consumer income available for spending versus interest payments.
Action: Quantitative easing
Result: Asset purchases by the Fed inject liquidity into credit markets and drive down interest rates. The Fed’s asset purchases, in combination with reductions in the Fed funds rate, has resulted in lower borrowing costs and improved market functioning. Yields on two-year Treasuries and 10-year Treasuries have declined 1.42% and 1.26%, respectively, since the beginning of the year, to 0.15% and 0.66%, respectively. Financial market functioning has improved meaningfully as well, such that the Fedhas gradually reduced the pace of asset purchases from $10 billion in Treasuries per day and $8 billion per day in mortgage-backed securities at the peak of the crisis in mid-March to $4 billion and $4.5 billion per day, respectively.
Action: Emergency bank liquidity facilities
Result: The Fed’s emergency liquidity facilities included overnight and term funding for primary dealers and dollar swap lines for global central banks. These measures helped restore adequate liquidity in the banking system. According to the minutes of the Federal Open Market Committee meeting on June 9-10, 2020, market functioning has improved substantially such that take-up in the Fed’s emergency liquidity facilities has declined.
Action: Commercial paper funding facility
Result: The purpose of this facility is to provide liquidity to short-term funding markets by purchasing unsecured and asset-backed commercial paper directly from eligible issuers. Commercial paper is an important short-term financing mechanism for the operational needs of many large companies. As of the most recent update (June 10, 2020), the Fed had purchased $4.2 billion in commercial paper. Conditions in unsecured short-term funding markets have improved since March, and spreads on commercial paper have declined to levels near pre-crisis ranges.
Action: Money Market Mutual Fund Liquidity Facility (MMLF)
Result: Money market funds are widely utilized investment vehicles for families and businesses. The MMLF is intended to assist money market funds in meeting demand for redemptions by providing a liquidity backstop to banks that purchase high-quality assets from the funds. Through June 30, the Fed had provided $21.4 billion of liquidity to money markets through this program. Unlike 2008, when the Reserve Primary Fund failed, no money market funds have “broken the buck” during this crisis.
Action: Term Asset-Backed Securities Loan Facility (TALF)
Result: TALF is intended to support the provision of credit to consumers and businesses by enabling the issuance of securities backed by private student loans, auto loans, credit card receivables, and other assets. TALF is operational but has not purchased a meaningful amount of assets to date.
Action: Primary Market Corporate Credit Facility (PMCCF) and Secondary Market Corporate Credit Facility (SMCCF)
Result: The Fed established these programs to support large businesses through the purchases of corporate bonds and bank loans. The PMCCF provides credit to qualifying issuers by purchasing new issues of corporate bonds. The SMCCF is intended to support market liquidity for corporate debt by purchasing individual investment grade corporate bonds and investment grade and high-yield ETFs. The cap on these programs is $750 billion and the program ends in September. As of mid-June, the Fed had purchased approximately $8 billion in bond market ETFs and $400 million in principal amount of corporate bonds under the SMCCF. The PMCCF became operational on June 29, but no significant purchases have been made to date. While the dollar amount of the Fed’s purchases is not meaningful relative to the size of the credit markets, We believe the establishment of these facilities restored the necessary confidence for buyers to take risk and returned the markets to orderly function.
Action: Main Street Lending Program
Result: The Federal Reserve designed the Main Street program to support small and medium-sized businesses (defined as 15,000 employees or less or $5 billion in revenues or less) that were generally unable to obtain funding under the Payroll Protection Program for small businesses. Main Street loans are not forgivable but have deferred interest payments for one year and deferred principal for two years. The Fed is currently accepting loan applications but has yet to extend any meaningful economic support through this program. The Fed is considering ways to include not-for-profit organizations in this program.
Action: Municipal Liquidity Facility
Result: Financing conditions for state and local governments improved moderately in the quarter, but mainly due to improved risk sentiment and other government measures to support the economy. Credit remains constrained for lower-rated states and municipalities. Illinois was the only state to use the Fed’s Municipal Liquidity Facility.
The Fed’s measures provided essential support to financial markets at a time of severe economic uncertainty and liquidity strains. The Fed provided access to essential short-term liquidity and restored financial market confidence in many cases by simply promising to buy if needed, but not actually buying in large amounts. After selling off 20% in the first quarter, the S&P 500 ended the second quarter down only 4% year-to-date. Credit spreads have recovered significantly. Using its “full range of tools,” we believe the Fed minimized the long-term economic damage resulting from the coronavirus shock.
Effective Fiscal Stimulus
In addition the Federal Reserve’s efforts to keep financial markets functioning through monetary stimulus, the federal government has passed multiple pieces of legislation, most significantly the Cares Act, to provide support from a fiscal perspective. Actions included in the Act and the results to date are below.
Action: $532 billion in bailout funds
Result: This money appears to have gone largely unspent to date. Included in these funds were approximately $60 billion for grants and loans to airlines and other businesses critical to national security. Passenger airlines were provided with $25 billion in payroll support lasting through September 2020 and another $25 billion in loans. Some of the bailout funds been used to establish equity backstops for the various Fed asset purchase facilities.
Action: $350 billion Paycheck Protection Program
Result: Forgivable paycheck protection loans were designed to assist small businesses and help keep workers on payrolls during the pandemic. Demand for the program was robust, implementation was relatively quick, and the initial $350 billion was exhausted. Congress amended the program during the second quarter to add an additional $320 billion and ease stipulations for forgiveness. To date, approximately $540 billion of the $670 billion in total funds have been utilized. While the program generated controversy over who received funds and whether they truly helped small businesses in need, the initiative as a whole must be considered a success. The program quickly injected over $500 billion into the economy and incentivized the retention of workers.
Action: $290 billion in stimulus payments, $260 billion for expanded unemployment insurance
Result: The effects of stimulus payments and expanded unemployment insurance benefits can best been seen in personal income and spending data. Personal income declined 2.2% month over month in March, increased 10.8% in April due to stimulus payments, and declined 4.2% YoY in May as stimulus distributions declined but were partly offset by increased unemployment benefits. Consumers were reluctant to spend, however, as personal spending declined 6.6% and 12.6% MoM in March and April, respectively, before gaining 8.2% in May as the economy reopened. Indexed to February levels, May personal income was 3.8% higher than February but spending was 11.7% lower. Consumers have mostly saved government benefits as they await clarity on employment prospects.
Action: $290 billion in tax cuts, deferrals, and other benefits for businesses
Results: Tax cuts have and deferrals have freed up business cash flow for investment and spending. Equity and credit markets have recovered significantly. On the other hand, the federal budget deficit in June alone exceeded the deficit for all of 2019.
Action: $150 billion in direct aid to states
Result: States have managed to fund increased expenses for public health initiatives, but budgets are under severe pressure and significant spending cuts are looming. Many states do not have rainy day funds and cannot borrow to fund deficits. Programs and payrolls will be cut, creating a headwind to economy in the second half of 2020.
Action: $385 billion to aid to hospitals, veterans’ care, FEMA and others
Result: Distribution of this aid seems to have been successful to date. Stockpiles of protective equipment have improved, Covid-19 testing capacity has expanded, and hospitals have reopened for elective procedures. Bed capacity remains adequate in most areas of the country, though virus surges have required pauses or rollbacks in public health reopening guidelines in some areas.
These measures have provided essential support to households and businesses when the nation’s unemployment rate dramatically increased and incomes plummeted. The speed with which they were approved and signed into law was historic. Though more fiscal help may be needed, the rare cooperation in Washington D.C. this spring provided ballast to the economy and mitigated long-term damage.
Waiting for a Rebound
Economic data has tracked largely ahead of our projections detailed in our first-quarter letter. GDP growth declined at a 5% rate in the first quarter and Bloomberg consensus estimates look for a historic 33.7% rate of decline in the second quarter. Forecasters expect an 18% rebound in the third quarter and 6.9% gain in the fourth quarter.
After 22 million jobs were eliminated in March and April combined, employment numbers have improved more quickly than anticipated. The economy recovered 2.7 million and 4.8 million jobs in May and June, respectively. The unemployment rate peaked at 14.7% in April. Including workers as misclassified as employed but who were absent from work in April would have increased the rate to approximately 19.7%, close to our 20% estimate of peak unemployment. Unemployment declined to approximately 12.1% in June including misclassified workers. For perspective, unemployment topped out around 10% in the Great Recession. We expect the recovery in jobs to remain uneven as continued gains from reopening are partly offset by layoffs in the airline and government sectors and the potential for resumed public health restrictions in areas with surging virus cases.
Interest rates remained largely stable at low levels in the second quarter. The 10 -year Treasury yield inched lower to 0.66%, the two-year declined to 0.15% from 0.25% and the yield curve steepened modestly. Inflation, as measured by core PCE, has declined to 1% in May from 1.8% in February, below the Fed’s target of 2%. Oil prices have recovered to $40 in June from approximately $20 per barrel in March, but remain below December 2019 levels near $60. Despite the recovery in energy prices, we do not expect a significant increase in inflation or interest rates. Inflation ran below the Fed’s target when unemployment was 3.5%. We do not expect significant wage growth or inflation now that unemployment is in the double digits.
Just a Little Patience
As we entered the second quarter, credit spreads were beginning to normalize from their historic wide of mid-March. Trading with depth of bids and offers has returned to the credit markets after a few rugged weeks in the spring. New issuance has been robust as companies have fortified liquidity to ride out the Covid-19 storm. Most corporate sectors have tightened significantly. We believe that high-quality companies with strong balance sheets and stable liquidity sources that form the traditional core holdings of our portfolios will survive and recover, though the road to recovery will be slow and bumpy.
We believe the Fed will continue to keep the federal funds target rate at 0% to 0.25% for the foreseeable future. They will also step in if liquidity issues return to the market, though we do not assign a high probability to that outcome. The programs implemented by the Fed and Congress have effectivity mitigated technical fixed income risks so far. However, fundamental underlying credit risks are very much in play. We continue to like both investment grade and high yield corporate debt but expect only limited spread tightening for the balance of the year. Volatility will remain in the market until a vaccine is developed for the coronavirus. We do not expect the virus to simply go away and we continue to manage investment risks with regard to public health.
We believe our portfolios have held up well during this crisis. Our consistent returns over time are the result of our investment process—working diligently each day to measure risk between various opportunities and assess relative value. We learned from the Great Recession that there were many investors who did not understand what they owned in their fixed income portfolios and underestimated the inherent risks. It is clear to us that there will always be a place for long-only, fundamental fixed income managers.
DISCLOSURE
© 2020 Oppenheimer Asset Management Inc. This commentary is intended for informational purposes only. The information and statistical data contained herein have been obtained from sources we believe to be reliable. Oppenheimer Investment Advisers (OIA) is a division of Oppenheimer Asset Management Inc. The opinions expressed are those of Oppenheimer Asset Management Inc. (“OAM”) and its affiliates and are subject to change without notice. No part of this commentary may be reproduced in any manner without the written permission of OAM or any of its affiliates. Any securities discussed should not be construed as a recommendation to buy or sell and there is no guarantee that these securities will be held for a client’s account nor should it be assumed that they were or will be profitable. Past performance does not guarantee future comparable results.
Indices are unmanaged, hypothetical portfolios of securities that are often used as a benchmark in evaluating the relative performance of a particular investment. An index should only be compared with a mandate that has a similar investment objective. An index is not available for direct investment, and does not reflect any of the costs associated with buying and selling individual securities or management fees.
High-yield bonds, those rated below investment grade, are not suitable for all investors. The risk of default may increase due to changes in the issuer's credit quality. Price changes will occur as a result of changes in interest rates and available market liquidity of a bond. When appropriate, these bonds should only comprise a modest portion of a portfolio.
Special Risks of Fixed Income Securities: there is a risk that the price of these securities will go down as interest rates rise. Another risk of fixed income securities is credit risk, which is the risk that an issuer of a bond will not be able to make principal and interest payments on time. Liquidity risk refers to the risk that investors won’t find an active market for a bond, potentially preventing them from buying or selling when they want and obtaining a certain price for the bond. Many investors buy bonds to hold them rather than to trade them, so the market for a particular bond or a small position in a bond may not be especially liquid and quoted prices for the same bond may differ.
OAM is a wholly owned subsidiary of Oppenheimer Holdings Inc. which also wholly owns Oppenheimer & Co. Inc. (“Oppenheimer”), a registered broker/dealer and investment adviser: Securities are offered through Oppenheimer and will not be insured by the FDIC or other similar deposit insurance, will not be deposits or other obligations of Oppenheimer or guaranteed by any bank or other financial institution, will not be endorsed or guaranteed by Oppenheimer and will be subject to investment risks, including the possible loss of principal invested.
This report contains forward-looking statements which reflect the current expectations of OAM regarding the economy and financial markets. These statements reflect OAM's current beliefs with respect to future events and are based on information currently available to OAM. Forward-looking statements involve significant known and unknown risks, uncertainties and assumptions. Many factors could cause actual results, performance or achievements to be materially different from any future results, performance or achievements that may be expressed or implied by such forward-looking statements. This material is not a recommendation as defined in Regulation Best Interest adopted by the Securities and Exchange Commission. It is provided to you after you have received Form CRS, Regulation Best Interest disclosure and other materials. 3176188.1