First Quarter 2021 Recap
- April 13, 2021
The primary financial market trends that commenced in Q4 2020 continued in Q1 2021. Investor optimism regarding vaccination distribution leading to economic normalization drove equities higher, with economically sensitive value and small cap segments outperforming growth and large cap, respectively. Interest rates at the long end of the curve spiked during the quarter catalyzing a pick-up in equity volatility. For many equity investors, particularly those focused on high growth, Treasury yields are an afterthought until they are the main focus. As 10-year Treasury yields increased 0.81%, or by 87% to 1.74%, during the quarter, the Treasury interest rate curve caught the attention of growth investors.
The U.S. Treasury interest rate curve is fundamental to investing and represents the “risk-free rate”. All investments are priced relative to the “risk-free rate”, i.e. any investment with greater risk than U.S. Government credit risk should require a premium to attract investment. The comparison of the 10-year U.S. Treasury to a 10-year AA-rated corporate bond is pretty straightforward. For example, if the 10-year Treasury yields 1%, a 10-year AA-rated corporate bond needs to offer a yield premium, also known as a credit spread, and perhaps yield 2%. The higher yield compensates investors for taking on increased credit risk, as a corporation does not have access to a U.S. dollar printing press nor the ability to raise taxes. As Treasury yields increase, investment-grade bond yields typically follow suit and the bonds in the market decline in value reflecting the relationship with higher rates.
The performance of longer-dated fixed income over the past two quarters is notable in that the 10-year Treasury yield was a scant 0.69% entering Q4. Over the subsequent two quarters, the Treasury Long index (10+ year Treasury maturities) returned -16.1% which wiped out over 23 years of potential return. As expected, high grade bonds also declined over the past two quarters.
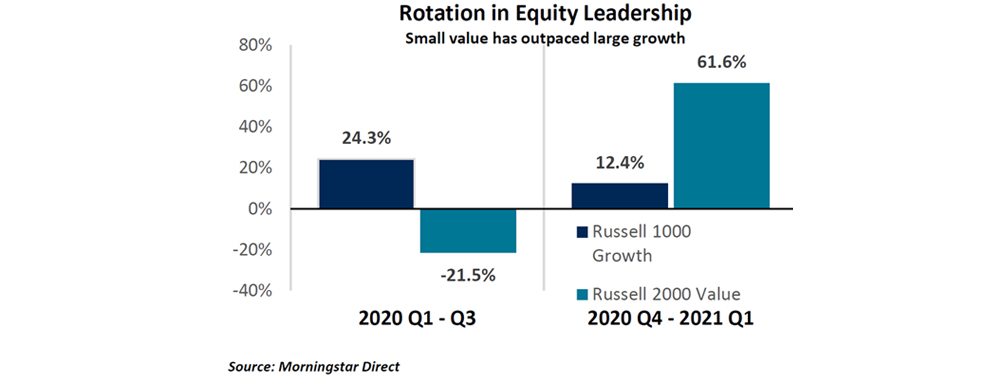
Valuing an equity security relative to U.S. Treasury yields is a bit more complex, as there are a number of pertinent factors and relationships. Since the Covid-19 vaccine development news in Q4, increased economic growth and inflation expectations have driven a steepening of the yield curve. Value stocks have outperformed growth stocks over the last two quarters and particularly since the vaccine development news in November.
In Q1, from February 13 to March 8, large cap growth stocks, as represented by the Russell 1000 Growth index, experienced a drawdown of -9.7% as the 10-year Treasury yield increased by 0.39%, a 33% increase, during the same period. A large number of the highest valuation multiple growth stocks fell significantly greater than -10% during this stretch. During the same time period, large cap value stocks, represented by the Russell 1000 Value index, appreciated by 2.9%. There are a number of contributing factors driving the returns of each equity segment.
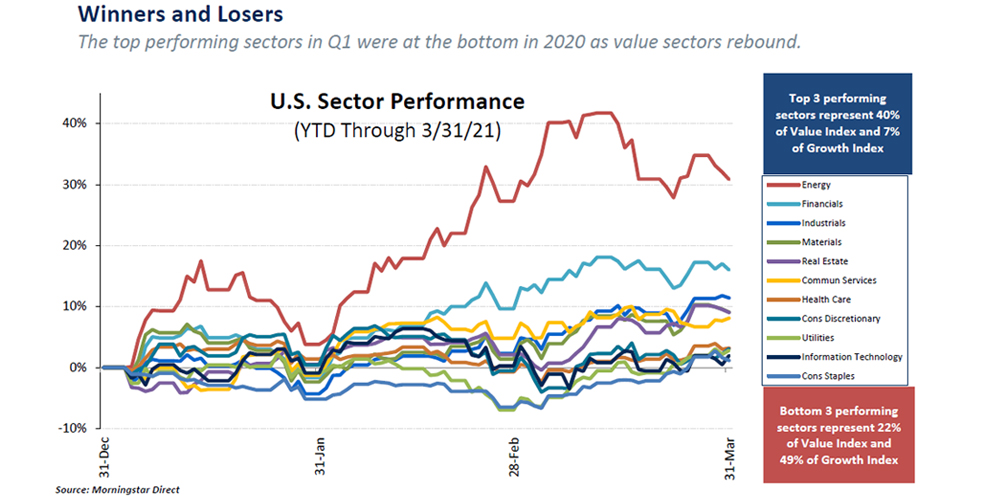
1. Economic: As confidence in the strength of the economy increases, investors typically seek to allocate capital to assets that have higher sensitivity to economic growth. Cyclically oriented sectors, including energy, financials and industrials, comprise a large portion of the value segment and significantly outperformed.
2. Valuation: Equity valuations are based on a present value calculation of future cash flows. The valuations of companies that have a long runway of high cash flow growth are more sensitive to changes in longer-term interest rates than low growth companies. Dividend-paying stocks with stable earnings, often referred to as bond proxies, are also negatively impacted by rising interest rates as yield-seeking investors opt to swap into bonds which have a lower risk of principal impairment.
3. Fundamental: While most sectors’ primary business fundamentals are not tied directly to interest rates or the shape of the interest rate curve, financials, and particularly banks, generally benefit from higher interest rates. A bank generates earnings from its net interest margin, the difference between the interest it collects on loans and the interest it pays out to depositors. A steeper yield curve drives a higher net interest margin. Financials are predominantly classified as value stocks.
4. Borrowing Costs: A company’s ability to borrow and refinance at lower costs directly accrues to shareholders. The borrowing costs of highly leveraged, economically sensitive borrowers can move inversely to U.S. Treasury interest rates, particularly during periods of strong economic optimism. High yield credit was positive in each of the last two quarters while interest rates climbed, reflecting lower borrowing costs for non-investment grade borrowers. Investors’ enhanced appetite for risk-taking drives credit spreads to contract.
As the economy continues to return to normal, equity investors will be more keenly focused on the yield curve to inform valuation and investment decisions.
Commentary on the various market segments for the quarter:
US Equity Style
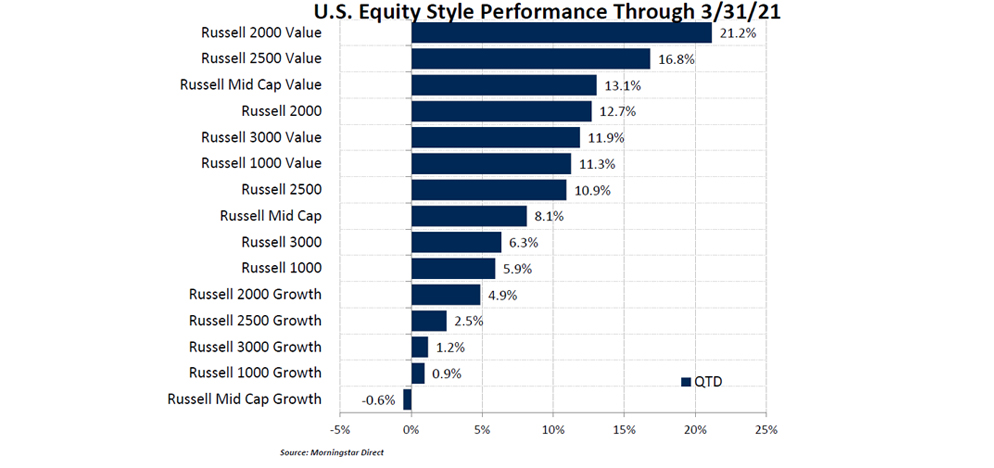
All US equity styles and market caps appreciated by double digits as the lagging indices crossed into positive territory for the year in Q4. Small caps significantly outperformed large caps and value made up some ground on growth across the board during the quarter. Below are highlights on style performance for the quarter.
- The key driver of performance during the quarter was market cap as the small and mid-cap indices outperformed the large cap index by a wide margin.
- The Value style outperformed the Growth style during the quarter across all market cap segments. All Value indices entered the quarter in negative territory but ended the year positive.
- High Beta, Pure Value and Enhanced Value factors performed strongly during the quarter relative to other factors. Weaker performing factors on a relative basis were Low Volatility, Momentum and Quality.
- The dispersion between the best performing style (Small Cap Value) and the worst performing style (Large Cap Growth) during the quarter was 22.0%, indicating that style had a meaningful impact on active manager performance.
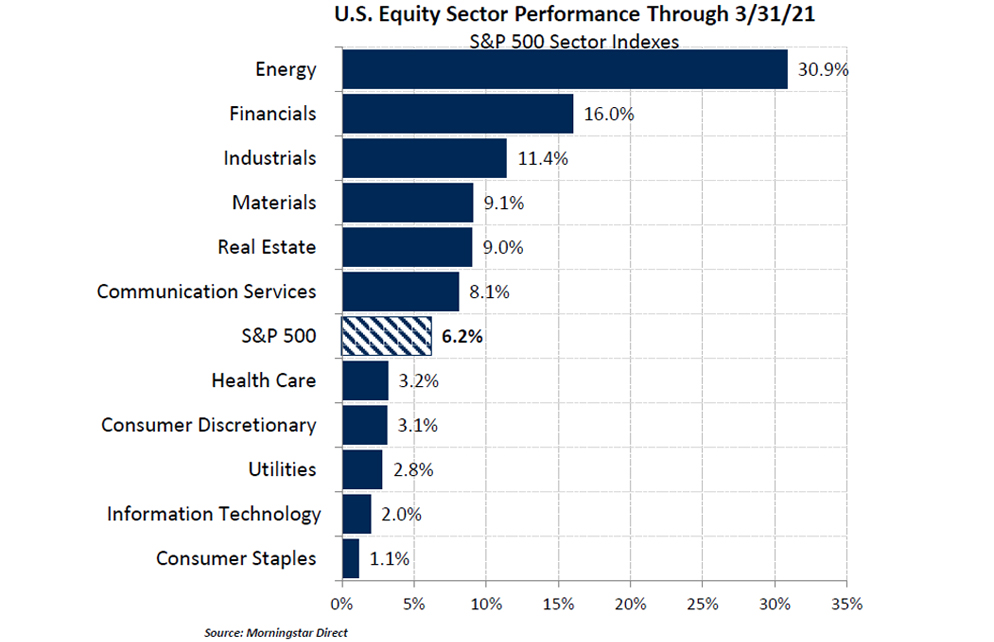
U.S. Sectors
All sectors were positive in the quarter. Energy, Financials and Industrials were the top performing sectors for the second consecutive quarter. Consumer Staples, Information Technology and Utilities were the worst performers but generated positive returns in the quarter. Below are highlights on sector performance for the quarter.
- Energy, Financials and Industrials generated double digit gains and were the top performing sectors for the second consecutive quarter.
- Consumer Staples, Information Technology and Utilities were the worst performers but generated positive returns in the quarter. These sectors were surpassed by more cyclically sensitive sectors.
- There was a wide degree of dispersion between the best and worst performing sectors for the quarter. The level of dispersion was 29.8% with the Energy sector being the best performer and the Consumer Staples sector being the worst performer indicating that sector positioning had a meaningful impact on active management.
Non-U.S. Markets
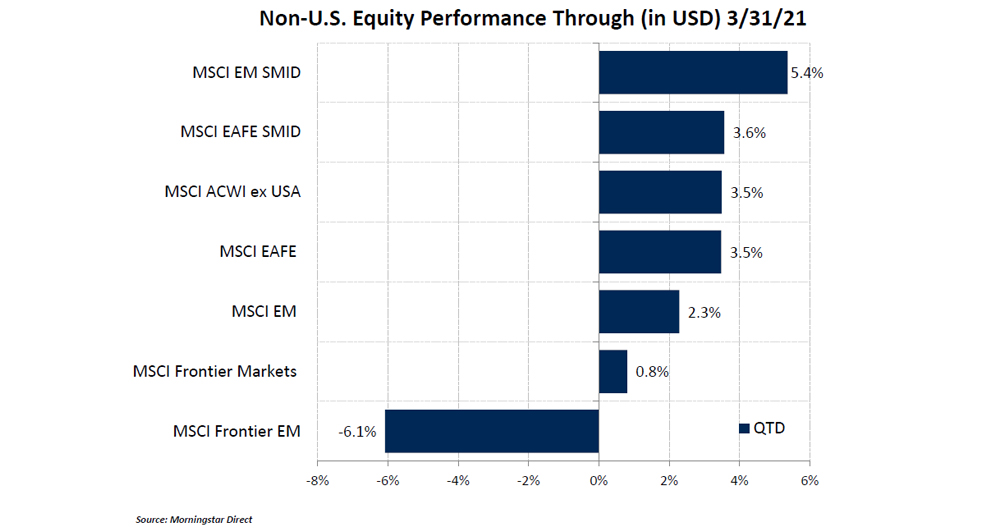
International and emerging markets rallied during the quarter, and all but one index, MSCI Frontier EM, finished the quarter with positive performance. Below are highlights on performance of international and emerging markets during the quarter.
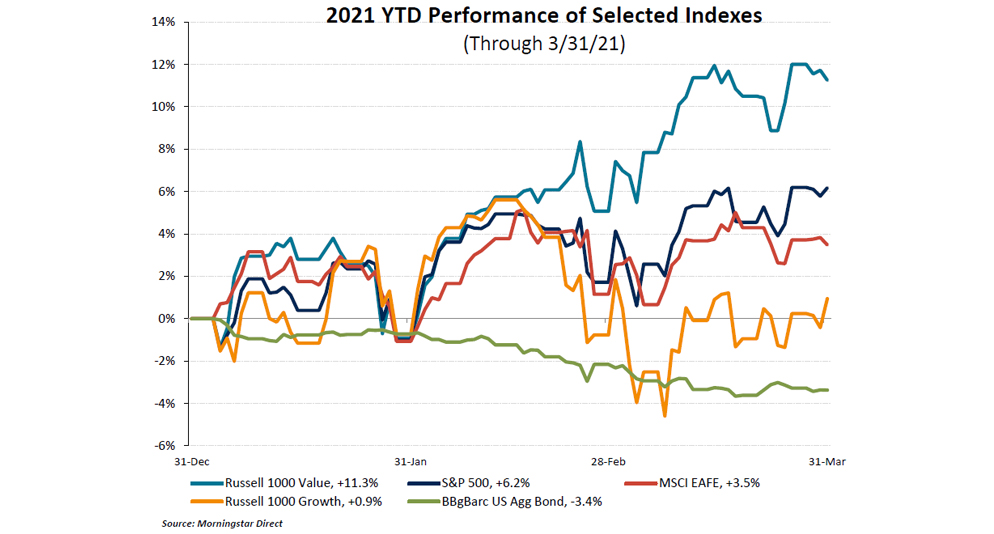
- The MSCI EAFE index returned 3.5% during the quarter underperforming the S&P 500’s 6.2% return.
- The value style outperformed the growth style within international markets.
- Consumer Staples, Utilities and Consumer Discretionary were the strongest performers in the quarter. Energy, Communication Services and Materials were the weakest performing sectors.
- Small cap stocks outperformed large cap stocks across international and EM markets.
- Asia and Europe developed market regions were both positive performers generating comparable performance in the quarter.
- Emerging markets slightly underperformed developed international markets for the quarter as the MSCI EM Index gained 2.3%.
- Within emerging markets the Materials, Communication Services and Information Technology sectors were the top performers for the quarter. Health Care, Consumer Discretionary and Consumer Staples were the weakest performing sectors.
- Most major currencies depreciated relative to the U.S. Dollar during the quarter, serving as a headwind on foreign investments for U.S. investors.
- Frontier markets generated flat to negative returns and underperformed relative to the broad emerging markets for the quarter. The MSCI Frontier Emerging Markets Index was down -6.1% while the MSCI Frontier Markets Index returned 0.8%.
Fixed Income
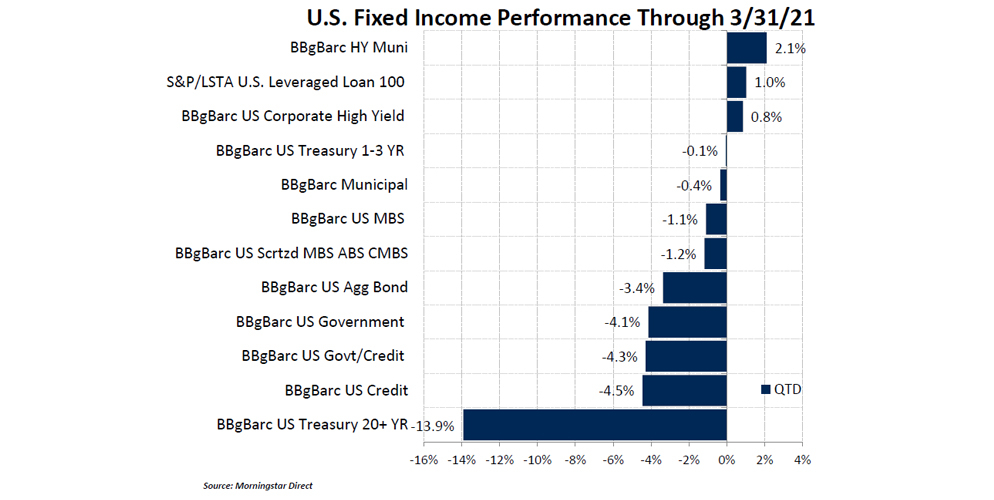
Yields remain on a historical basis but the yield curve steepened substantially during the quarter. The 2-year and 10-year Treasuries entered the quarter yielding 0.13% and 0.93%, respectively. While near-term rates remained low and stable, longer term rates increased during the reflationary risk-on rally leading to a steeper yield curve. Corporate credit returns were mixed during the quarter. Below are highlights on fixed income performance during the quarter.
- The 10-Year Treasury yield started the quarter at 0.93% and ended the quarter at 1.74%. Treasury prices on longer dated maturities declined as the yield curve steepened. Treasuries across the curve were flat to down during the quarter.
- High Yield credit rallied in as investors drove the highest risk credit spreads tighter. The Bloomberg Barclays U.S. Credit index returned -4.5% while the U.S. Corporate High Yield Credit index returned 0.9%. High yield was the best performing fixed income segment as spreads tightened from 386 basis points at the beginning of the quarter to 336 basis points at the end of the quarter.
- The best performing segment of the fixed income markets were the CCC to D-rated high yield corporate bonds.
- Leveraged loans floating rate appreciated due to credit spread tightening as the S&P/LSTA U.S. Leveraged Loan 100 Index returned 1.0%.
- Municipal bonds held up relatively well as tax exempt income increasingly looks attractive as investors anticipate changing tax rates from the new administration. The Bloomberg Barclays Municipal Bond index generated a -0.4% return for the quarter. High yield municipal bonds generated a return of 2.1%.
- Non-U.S. local currency global bonds faced headwinds from an appreciating U.S. Dollar during the quarter. Emerging market debt, both dollar and non-dollar, experienced declines. Just about all major developed and emerging market currencies declined relative to the U.S. Dollar.
Disclosures
Indices are unmanaged and presented for comparison purposes only. Please note that the returns displayed for indices do not take into account any of the costs associated with buying and selling individual securities. Individuals cannot invest directly in an index.
Bloomberg Barclays Capital U.S. Aggregate Bond Index: The U.S. Aggregate Index covers the USD-denominated, investment-grade, fixed-rate, taxable bond market of SEC-registered securities. The Index includes bonds from the Treasury,Government-Related, Corporate, MBS (agency fixed-rate and hybrid ARM pass throughs), ABS, and CMBS sectors. The U.S. Aggregate Index is a component of the U.S. Universal Index in its entirety. The index was created in 1986 with index history backfilled to January 1, 1976. All issues in the Aggregate Index are rated Baaa3/BBB-/BBB- or higher (using the middle rating of Moody’s, S&P, and Fitch, respectively) and have at least one year to maturity and have an outstanding par value of at least $250 million.
Bloomberg Barclays CMBS IG TR USD: The index measures the performance of investment-grade commercial mortgagebacked securities, which are classes of securities that represent interests in pools of commercial mortgages. The index includes only CMBS that are Employee Retirement Income Security Act of 1974, which will deem ERISA eligible the certificates with the first priority of principal repayment, as long as certain conditions are met, including the requirement that the certificates be rated in one of the three highest rating categories by Fitch, Inc., Moody’s Investors Services or Standard & Poor’s.
Bloomberg Barclays Municipal TR USD: The Bloomberg Barclays Municipal Bond Index is considered representative of the broad market for investment grade, tax-exempt bonds with a maturity of at least one year.
Bloomberg Barclays US Corp IG TR USD: The index measures the performance of investment grade corporate bonds.
Bloomberg Barclays US Corporate High Yield TR USD: Bloomberg Barclays US Corporate High Yield TR USD
Bloomberg Barclays US Govt/Credit Interm TR USD: A subgroup of the Bloomberg Barclays Government/Credit Bond Index that is based on maturity with greater than 1 to 10 years.
Bloomberg Barclays US Govt/Credit TR USD: The U.S. Government/Credit Bond Index is the non-securitized component of the U.S. Aggregate Index. Specifically, the Government/Credit Index includes treasuries (i.e., public obligations of the US Treasury that have remaining maturities of more than 1 year), Government-Related issues (i.e. agency, sovereign, supranational, and local authority debt) and Corporates ( publicly issued US corporate and Yankee debentures and secured notes that meet specified maturity, liquidity, and quality requirements). All issues in the Government/Credit Index are rated Baaa3/BBB-/BBB- or higher (using the middle rating of Moody’s, S&P, and Fitch, respectively) and have at least one year to maturity and have an outstanding par value of at least $250 million.
Bloomberg Barclays US MBS TR USD: The Bloomberg Barclays Mortgage-backed Securities Index is a market valueweighted index which covers the mortgage-backed securities component of the Bloomberg Barclays U.S. Aggregate Bond Index. The index is composed of agency mortgage-backed pass through securities of the Government National Mortgage Association (Ginnie Mae), the Federal National Mortgage Association (Fannie Mae), and the Federal Home Loan Mortgage Corporation (Freddie Mac) with a minimum $150 million par amount outstanding and a weighted-average maturity of at least 1 year. The index includes reinvestment of income
Bloomberg Barclays US Treasury 1-3 Yr TR USD: The Bloomberg Barclays Capital US Treasury Bond 1-3yr term index measures the performance of short-term government bonds issued by the US Treasury.
Bloomberg Barclays US Treasury 20+ Yr TR USD: The Index is market capitalization weighted and includes all of the securities that meet the Index criteria. The index includes all publicly issued, U.S. Treasury securities that have a remaining maturity greater than 20 years, are non-convertible, are denominated in U.S. dollars, are rated investment grade (Baa3 or better) by Moody’s Investors Service, are fixed rate, and have more than $150 million par outstanding. Excluded from the Index are certain special issues, such as flower bonds, targeted investor notes (TINs) and state and local government series bonds (SLGs), and coupon issues that have been stripped from assets already included.
Bloomberg Barclays US Treasury TR USD: The U.S. Treasury Index includes public obligations of the U.S. Treasury. Treasury bills are excluded by the maturity constraint but are part of a separate Short Treasury Index. In addition, certain special issues, such as state and local government series bonds (SLGs), as well as U.S. Treasury TIPS, are excluded. STRIPS are excluded from the index because their inclusion would result in double-counting. Securities in the index roll up to the U.S. Aggregate, U.S. Universal, and Global Aggregate Indices. The U.S. Treasury Index was launched on January 1, 1973.
Bloomberg Barclays US Treasury US TIPS TR USD: The Index includes all publicly issued, U.SS Treasury inflation-protected securities that have at least 1 year remaining to maturity, are rated investment grade and have $250 million or more of outstanding face value. In addition, the securities must be denominated in U.S. dollars and must be fixed rate and nonconvertible. The Index is market capitalization weighted and the securities in the Index are updated on the last calendar day of each month.
Europe Stoxx 600: The STOXX Europe 600 Index is derived from the STOXX Europe Total Market Index (TMI) and is a subset of the STOXX Global 1800 Index. With a fixed number of 600 components, the STOXX Europe 600 Index represents large, mid and small capitalization companies across 18 countries of the European region: Austria, Belgium, Czech Republic, Denmark, Finland, France, Germany, Greece, Ireland, Italy, Luxembourg, the Netherlands, Norway, Portugal, Spain, Sweden, Switzerland and the United Kingdom.
Russell 1000 Growth Index (R1000 Growth): Measures the performance of the Russell 1000 companies with higher price-tobook ratios and higher forecasted growth values.
Russell 1000 Index (Russell 1000): Measures the performance of the 1,000 largest companies in the Russell 3000 Index. Frank Russell Co. ranks the US common stocks from largest to smallest market capitalization at each annual reconstitution period. The Russell 1000 Index represents the vast majority of the total market capitalization of the Russell 3000 Index. It is considered to be generally representative of US Equity Large Cap performance.
Russell 1000 Value Index (R1000 Value): Measures the performance of the Russell 1000 companies with lower price-to-book ratios and lower forecasted growth values
Russell 2000 Growth Index (R2000 Growth): Measures the performance of those Russell 2000 companies with higher priceto-book ratios and higher forecasted growth values.
Russell 2000 Index (Russell 2000): Measures the performance of the 2,000 smallest companies in the Russell 3000 Index. Frank Russell Co. ranks the US common stocks from largest to smallest market capitalization at each annual reconstitution period. The Russell 2000 Index represents a very small percentage of the total market capitalization of the Russell 3000 Index. It is considered to be generally representative of US Equity Small and Mid Cap performance.
Russell 2000 Value Index (R2000 Value): Measures the performance of those Russell 2000 companies with lower price-tobook ratios and lower forecasted growth values Russell 3000 Growth: The Russell 3000 Growth Index measures the performance of the broad growth segment of the U.S. equity universe. It includes those Russell 3000 Index companies with higher price-to-book ratios and higher forecasted growth values.
Russell 3000 Index (Russell 3000): Measures the performance of the 3,000 largest US companies based on total market capitalization, which represents nearly the entire market capitalization of the investable US equity market. Frank Russell Co. ranks the US common stocks from largest to smallest market capitalization at each annual reconstitution period. Russell 3000 Value: The Russell 3000 Value Index measures the performance of the broad value segment of U.S. equity value universe. It includes those Russell 3000 Index companies with lower price-to-book ratios and lower forecasted growth values.
Russell Midcap Growth Index (Russell Midcap Growth): Contains those Russell Midcap (800) securities with a greater thanaverage growth orientation. Companies in this index tend to exhibit higher price-to-book and price-earnings ratios, lower dividend yields and higher forecasted growth values than the Value universe.
Russell Midcap Index (Russell Midcap): Measures the performance of the mid-cap segment of the US equity universe. The Russell Midcap Index includes the smallest 800 securities in the Russell 1000.
Russell Midcap Value Index (Russell Midcap Value): Contains those Russell Midcap (800) securities with a less-than average growth orientation. Securities in this index generally have lower price-to-book and price-earnings ratios, higher dividend yields and lower forecasted growth values than the Growth universe. S&P 500 Index: The S&P 500 Index consists of 500 stocks chosen for market size, liquidity, and industry group representation. It is a market value weighted Index (stock price times number of shares outstanding), with each stock’s weight in the Index proportionate to its market value. The Index is one of the most widely used benchmarks of US Equity Large Cap performance.
S&P 500 Sector/Consumer Discretionary Index: The S&P 500 Sector/Consumer Discretionary Index consists of stocks chosen for their representation in the Consumer Discretionary industry. The companies in the index tend to be the most sensitive to economic cycles. Manufacturing companies include automotive, household durable goods, textiles and apparel, and leisure equipment. Service companies include hotels, restaurants/leisure facilities, media production and services, consumer retailing and services and education services. It is a market value weighted Index (stock price times number of shares outstanding), with each stock’s weight in the Index proportionate to its market value. S&P 500 Sector/Consumer Staples Index: The S&P 500 Sector/Consumer Staples Index consists of stocks chosen for their representation in the Consumer Staples industry. The companies in the index tend to be the less sensitive to economic cycles. They include manufacturers and distributors of food, beverages and tobacco, and producers of non-durable household goods and personal products; also food and drug retailing companies. It is a market value weighted Index (stock price times number of shares outstanding), with each stock’s weight in the Index proportionate to its market value.
S&P 500 Sector/Energy Index: The S&P 500 Sector/Energy Index consists of stocks chosen for their representation in the Energy industry. The companies in the index are dominated by either the construction for provision of oil rigs, drilling equipment and other energy-related service and equipment or the exploration, production, marketing, refining and/or transportation of oil and gas products, coal and consumable fuels. It is a market value weighted Index (stock price times number of shares outstanding), with each stock’s weight in the Index proportionate to its market value.
S&P 500 Sector/Financials TR Index: The S&P 500 Sector/Financials Index consists of stocks chosen for their representation in the Financials industry. The companies in the index are involved in activities such as banking, consumer finance, investment banking and brokerage, asset management, insurance and investments, and real estate, including REITs. It is a market value weighted Index (stock price times number of shares outstanding), with each stock’s weight in the Index proportionate to its market value.
S&P 500 Sector/Healthcare TR Index: The S&P 500 Sector/Healthcare Index consists of stocks chosen for their representation in the Healthcare industry. The companies in the index are involved in health care equipment and supplies, health care-related services, or in the research, development, production and marketing of pharmaceuticals and biotechnology products. It is a market value weighted Index (stock price times number of shares outstanding), with each stock’s weight in the Index proportionate to its market value.
S&P 500 Sector/Industrials TR Index: The S&P 500 Sector/Industrials Index consists of stocks chosen for their representation in the Industrials industry. Companies include those that manufacture and distribute capital goods (i.e. aerospace/defense, construction, engineering and building products, electrical equipment and industrial machinery); provide commercial services and supplies (i.e. printing, employment, environmental/office services); or provide transportation services (i.e. airlines, couriers, marine, road/rail and transportation infrastructure). It is a market value weighted Index (stock price times number of shares outstanding), with each stock’s weight in the Index proportionate to its market value.
S&P 500 Sector/Information Technology TR Index: The S&P 500 Sector/Information Technology Index consists of stocks chosen for their representation in the Info Tech industry. Companies considered are involved in technology software and services and technology hardware and equipment. It is a market value weighted Index (stock price times number of shares outstanding), with each stock’s weight in the Index proportionate to its market value.
S&P 500 Sector/Materials TR Index: The S&P 500 Sector/Materials Index consists of stocks chosen for their representation in the Materials industry. These include companies that manufacture chemicals, construction materials, glass, paper, forest products and related packaging products, metals, minerals and mining companies, including steel producers. It is a market value weighted Index (stock price times number of shares outstanding), with each stock’s weight in the Index proportionate to its market value.
S&P 500 Sector/Telecommunication Services TR Index: The S&P 500 Sector/Telecom Services Index consists of stocks chosen for their representation in the Telecom industry. The companies in the index are involved in health care equipment and supplies, health care-related services, or in the research, development, production and marketing of pharmaceuticals and biotechnology products. It is a market value weighted Index (stock price times number of shares outstanding), with each stock’s weight in the Index proportionate to its market value.
S&P 500 Sector/Utilities TR Index: The S&P 500 Sector/Utilities Index consists of stocks chosen for their representation in the Utilities industry. Companies considered include electric, gas or water utilities, or companies that operate as independent producers and/or distributors of power. It is a market value weighted Index (stock price times number of shares outstanding), with each stock’s weight in the Index proportionate to its market value.
S&P/LSTA Leveraged Loan TR: The S&P/LSTA U.S. Leveraged Loan 100 Index is designed to reflect the performance of the largest facilities in the leveraged loan market. Yield Index but caps issuer exposure at 2%. Index constituents are capitalization-weighted, based on their current amount outstanding, provided the total allocation to an individual issuer does not exceed 2%. Issuers that exceed the limit are reduced to 2% and the face value of each of their bonds is adjusted on a pro-rata basis. Similarly, the face values of bonds of all other issuers that fall below the 2% cap are increased on a pro-rata basis. In the event there are fewer than 50 issuers in the Index, each is equally weighted and the face values of their respective bonds are increased or decreased on a pro rata basis.
The success of an investment program may be affected by general economic and market conditions, such as interest rates, availability of credit, inflation rates, economic uncertainty, changes in laws and national and international political circumstances. These factors may affect the level and volatility of securities prices and the liquidity of a portfolio’s investments. Unexpected volatility or illiquidity could result in losses.
Investing in securities is speculative and entails risk. There can be no assurance that one’s investment objectives will be achieved or that an investment strategy will be successful. Significant losses could result if a strategy involves the use leverage, short sales and derivative transactions, investment in foreign or illiquid securities, and potentially limited diversification. Past performance is not a guarantee of future results.
For fixed income securities, there is a risk that the price of these securities will go down as interest rates rise. Another risk of fixed income securities is credit risk, which is the risk that an issuer of a bond will not be able to make principal and interest payments on time. Liquidity risk is the risk that you might not be able to buy or sell investments quickly for a price that is close to the true underlying value of the asset. When a bond is said to be liquid, there's generally an active market of investors buying and selling that type of bond. High yield fixed income securities are considered to be speculative and involve a substantial risk of default. Adverse changes in economic conditions or developments regarding the issuer are more likely to cause price volatility for issuers of high yield debt than would be the case for issuers of higher grade debt securities.
Special Risks of Foreign Securities
Investments in foreign securities are affected by risk factors generally not thought to be present in the US. The factors include, but are not limited to, the following: less public information about issuers of foreign securities and less governmental regulation and supervision over the issuance and trading of securities.
Special Risks of Small Market Capitalization Securities
Investments in companies with smaller market capitalization are generally riskier than investments in larger, well-established companies. Smaller companies often are more recently formed than larger companies and may have limited product lines, distribution channels and financial and managerial resources. These companies may not be well known to the investing public, may not have significant institutional ownership and may have cyclical, static or moderate growth prospects. There is often less publicly available information about these companies than there is for larger, more established issuers, making it more difficult for the Investment Manager to analyze that value of the company. The equity securities of small and mid-capitalization companies are often traded over-the-counter or on regional exchanges and may not be traded in the volume typical for securities that are traded on a national securities exchange. Consequently, the Investment Manager may be required to sell these securities over a longer period of time (and potentially at less favorable prices) than would be the case for securities of larger companies. In addition, the prices of the securities of small and midcapitalization companies may be more volatile that those of larger companies.
Special Risks of Master Limited Partnerships
Master limited partnerships (MLPs) are publicly listed securities that trade much like a stock, but they are taxed as partnerships. MLPS are typically concentrated investments in assets such as oil, timber, gold and real estate. The risks of MLPS include concentration risk, illiquidity, exposure to potential volatility, tax reporting complexity, fiscal policy and market risk. MLPS are not suitable for all investors.
© 2020 All rights reserved. This report is intended for informational purposes only. All information provided and opinions expressed are subject to change without notice. The information and statistical data contained herein have been obtained from sources we believe to be reliable. No part of this report may be reproduced in any manner without the written permission of Oppenheimer Asset Management or any of its affiliates. Any securities discussed should not be construed as a recommendation to buy or sell and there is no guarantee that these securities will be held for a client’s account nor should it be assumed that they were or will be profitable. The Consulting Group is a division of Oppenheimer Asset Management. Oppenheimer Asset Management is the name under which Oppenheimer Asset Management Inc. (“OAM”) does business. OAM is an indirect, wholly owned subsidiary of Oppenheimer Holdings Inc., which is also the indirect parent of Oppenheimer & Co. Inc. (“Oppenheimer”). Oppenheimer is a registered investment adviser and broker dealer. Securities are offered through Oppenheimer. 3029676.1