
Market Observations: August 2023 Recap
Global equity markets fell as interest rates rose during the month of August. The S&P 500 fell -1.6%, holding up better than international markets as the MSCI EAFE and MSCI EM indices returned -3.8% and -6.2%, respectively, for the month. The 10-year Treasury yield rose and ended the month yielding 4.09%, a 0.12% increase from where it began the month. The closely followed 2yr/10yr yield spread ended the month at -0.76%, less inverted than at the start of the month.
Central bankers and economists gathered in Wyoming for the annual Jackson Hole Economic Symposium last month. Fed Chair Powell’s much anticipated speech was a stark contrast to his remarks last year when the fed funds rate was 3% lower. While last year’s speech was brief and blunt in focusing on “forcefully” restoring price stability that could “bring some pain to households and businesses,” Fed Chair Powell was more verbose and nuanced this year. Powell’s latest speech was 60% longer and disaggregated various inflationary drivers and trends. Notably, the Fed Chair stated that to achieve both price stability and maximum employment, they must utilize “agile policymaking” to balance “the risk of tightening monetary policy too much against the risk of tightening too little.”
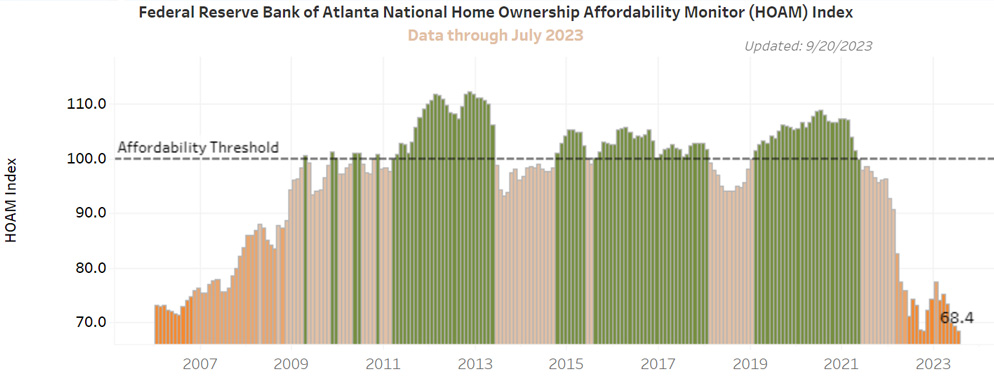
Fed Chair Powell addressed the highly interest rate-sensitive housing sector, which is directly impacted by monetary policy. While Chair Powell highlighted the favorable sale price trends and confidently anticipated leasing data “in the pipeline” will positively impact inflation over the coming year, he did not broach the subject of affordability. Home ownership affordability has steadily declined since January and currently is worse than at any point leading up to the global financial crisis. Despite an average 30-year mortgage rate that is greater than 7.5%, existing home sale prices have recently ticked up 2%. One major reason is the continued lack of existing home supply. In July, existing home inventory was down 15% and transactions were down 17% from a year earlier.
How does this home ownership affordability issue get resolved?
Homebuilders are working hard to fill the gap in the market and have even started incentivizing buyers with mortgage rate buy downs, closing cost rebates and free upgrades. Another potential source of supply is the Airbnb landlords who are increasingly squeezed by a slowdown of domestic travelers, higher refinancing rates and increased regulation. The real elephant in the room is the job market. A weaker labor market would likely lead to an increase in housing supply from laid off workers, a cooling of purchaser demand as confidence wanes and a lowering of mortgage rates. Although these factors would improve affordability, I don’t anticipate existing homeowners would be willing to volunteer for “some pain” to improve others’ purchasing power.
The Fed is acutely aware of the two-sided risks it faces as it attempts to achieve a soft landing. If monetary policy is not restrictive enough, inflation expectations can become unanchored and then require even more policy action at a higher cost to the economy. Maintaining an overly restrictive monetary policy would unnecessarily slow the economy and increase the unemployment rate.
As Chair Powell faces potentially challenging terrain and difficult decisions ahead, it is understandable as to why he decided to make more expansive remarks before concluding with the same message as last year, “We will keep at it until the job is done.”
Summary of key points that occurred in the markets globally during the month.
US Equity Summary:
-
The S&P 500 returned -1.6% for the month and the year-to-date return ended the month 18.7%.
-
Small and mid-cap equity underperformed large cap according to the Russell market cap indices.
-
Growth outperformed value across large and mid-cap segments but underperformed within small cap according to the Russell style indices.
-
All S&P 500 sectors, except Energy, generated negative returns for the month. Energy, Communication Services and Healthcare were the top performing sectors. Utilities, Consumer Staples and Materials were the weakest performing sectors.
-
Quarterly S&P 500 earnings growth was -4.1%. Of the reporting companies, 79% reported positive earnings surprises.
-
From a factor perspective, according to S&P Factor indices Momentum, Quality and Growth performed the best. High Beta, High Dividend and Pure Value fared the worst.
Developed and Emerging Market Equity Summary:
-
The MSCI EAFE Index returned -3.8% for the month, outperforming the MSCI EM Index, which returned -6.2%.
- The small and mid-cap segments outperformed within international developed and emerging markets according to the MSCI EAFE Smid and EM Small and Mid Cap indices.
- Energy, Healthcare and Consumer Staples were the top performing international equity sectors according to the MSCI EAFE index. Real Estate, Consumer Discretionary and Communication Services were the weakest performing sectors.
- Energy, Information Technology and Consumer Staples were the top performing emerging market equity sectors according to the MSCI EM index. Consumer Discretionary, Communication Services and Utilities were the weakest performing sectors.
- Frontier markets outperformed emerging markets, as the MSCI Frontier Markets Index returned -0.9%.
- From a factor perspective within international equities, according to MSCI Factor indices Minimum Volatility, Enhanced Value and Diversified Multi-Factor performed the best, while Quality, Equal Weighted and High Dividend Yield performed the worst. Within emerging markets, Quality, Minimum Volatility and High Dividend Yield fared the best, while Momentum, Equal Weighted and Value Weighted were the laggards.
Fixed Income Summary:
-
Yields on most maturities on the Treasury rate curve moved higher during the month. Yields on the longest maturities rose the most while the yields on the 6-month and 2-year maturities fell during the month.
- The 10-year Treasury bond fell during the month as yields rose and ended the month yielding 4.09%, a 0.12% increase from where it began the month yielding 3.97%.
- The greatest increase in yields occurred with the 30-year maturity, which increased by 0.18%. The closely followed 2yr/10yr yield spread ended the month at -0.76%, less inverted than at the start of the month.
- Investment grade credit generated negative returns, posting a -0.7% return as per the Bloomberg U.S. Credit Index.
- High yield spreads widened slightly during the month, but yield drove the Bloomberg U.S. Corporate High Yield Index to rise 0.3%.
- The broad Bloomberg Global Aggregate Bond Index posted a -1.4% return for the month.
- Municipal bonds fell -1.4% as per the Bloomberg Municipal Bond Index, with the high yield segment down -1.5%.
- Non-U.S. hard currency sovereign bonds were down -2.0% as per the FTSE WGBI Non-USD. Emerging market corporate debt (JPM CEMBI Broad Diversified) and local currency denominated sovereign debt (JPM GBI-EM Diversified Composite) declined during the month.
- The U.S. Dollar index was up 1.7% for the month.
Indices are unmanaged and presented for comparison purposes only. Please note that the returns displayed for indices do not take into account any of the costs associated with buying and selling individual securities. Individuals cannot invest directly in an index.
Bloomberg Barclays Capital U.S. Aggregate Bond Index: The U.S. Aggregate Index covers the USD-denominated, investment-grade, fixed-rate, taxable bond market of SEC-registered securities. The Index includes bonds from the Treasury,Government-Related, Corporate, MBS (agency fixed-rate and hybrid ARM pass throughs), ABS, and CMBS sectors. The U.S. Aggregate Index is a component of the U.S. Universal Index in its entirety. The index was created in 1986 with index history backfilled to January 1, 1976. All issues in the Aggregate Index are rated Baaa3/BBB-/BBB- or higher (using the middle rating of Moody’s, S&P, and Fitch, respectively) and have at least one year to maturity and have an outstanding par value of at least $250 million.
Bloomberg Barclays CMBS IG TR USD: The index measures the performance of investment-grade commercial mortgagebacked securities, which are classes of securities that represent interests in pools of commercial mortgages. The index includes only CMBS that are Employee Retirement Income Security Act of 1974, which will deem ERISA eligible the certificates with the first priority of principal repayment, as long as certain conditions are met, including the requirement that the certificates be rated in one of the three highest rating categories by Fitch, Inc., Moody’s Investors Services or Standard & Poor’s.
Bloomberg Barclays Municipal TR USD: The Bloomberg Barclays Municipal Bond Index is considered representative of the broad market for investment grade, tax-exempt bonds with a maturity of at least one year.
Bloomberg Barclays US Corp IG TR USD: The index measures the performance of investment grade corporate bonds.
Bloomberg Barclays US Corporate High Yield TR USD: Bloomberg Barclays US Corporate High Yield TR USD
Bloomberg Barclays US Govt/Credit Interm TR USD: A subgroup of the Bloomberg Barclays Government/Credit Bond Index that is based on maturity with greater than 1 to 10 years.
Bloomberg Barclays US Govt/Credit TR USD: The U.S. Government/Credit Bond Index is the non-securitized component of the U.S. Aggregate Index. Specifically, the Government/Credit Index includes treasuries (i.e., public obligations of the US Treasury that have remaining maturities of more than 1 year), Government-Related issues (i.e. agency, sovereign, supranational, and local authority debt) and Corporates ( publicly issued US corporate and Yankee debentures and secured notes that meet specified maturity, liquidity, and quality requirements). All issues in the Government/Credit Index are rated Baaa3/BBB-/BBB- or higher (using the middle rating of Moody’s, S&P, and Fitch, respectively) and have at least one year to maturity and have an outstanding par value of at least $250 million.
Bloomberg Barclays US MBS TR USD: The Bloomberg Barclays Mortgage-backed Securities Index is a market valueweighted index which covers the mortgage-backed securities component of the Bloomberg Barclays U.S. Aggregate Bond Index. The index is composed of agency mortgage-backed pass through securities of the Government National Mortgage Association (Ginnie Mae), the Federal National Mortgage Association (Fannie Mae), and the Federal Home Loan Mortgage Corporation (Freddie Mac) with a minimum $150 million par amount outstanding and a weighted-average maturity of at least 1 year. The index includes reinvestment of income
Bloomberg Barclays US Treasury 1-3 Yr TR USD: The Bloomberg Barclays Capital US Treasury Bond 1-3yr term index measures the performance of short-term government bonds issued by the US Treasury.
Bloomberg Barclays US Treasury 20+ Yr TR USD: The Index is market capitalization weighted and includes all of the securities that meet the Index criteria. The index includes all publicly issued, U.S. Treasury securities that have a remaining maturity greater than 20 years, are non-convertible, are denominated in U.S. dollars, are rated investment grade (Baa3 or better) by Moody’s Investors Service, are fixed rate, and have more than $150 million par outstanding. Excluded from the Index are certain special issues, such as flower bonds, targeted investor notes (TINs) and state and local government series bonds (SLGs), and coupon issues that have been stripped from assets already included.
Bloomberg Barclays US Treasury TR USD: The U.S. Treasury Index includes public obligations of the U.S. Treasury. Treasury bills are excluded by the maturity constraint but are part of a separate Short Treasury Index. In addition, certain special issues, such as state and local government series bonds (SLGs), as well as U.S. Treasury TIPS, are excluded. STRIPS are excluded from the index because their inclusion would result in double-counting. Securities in the index roll up to the U.S. Aggregate, U.S. Universal, and Global Aggregate Indices. The U.S. Treasury Index was launched on January 1, 1973.
Bloomberg Barclays US Treasury US TIPS TR USD: The Index includes all publicly issued, U.SS Treasury inflation-protected securities that have at least 1 year remaining to maturity, are rated investment grade and have $250 million or more of outstanding face value. In addition, the securities must be denominated in U.S. dollars and must be fixed rate and nonconvertible. The Index is market capitalization weighted and the securities in the Index are updated on the last calendar day of each month.
Europe Stoxx 600: The STOXX Europe 600 Index is derived from the STOXX Europe Total Market Index (TMI) and is a subset of the STOXX Global 1800 Index. With a fixed number of 600 components, the STOXX Europe 600 Index represents large, mid and small capitalization companies across 18 countries of the European region: Austria, Belgium, Czech Republic, Denmark, Finland, France, Germany, Greece, Ireland, Italy, Luxembourg, the Netherlands, Norway, Portugal, Spain, Sweden, Switzerland and the United Kingdom.
Russell 1000 Growth Index (R1000 Growth): Measures the performance of the Russell 1000 companies with higher price-tobook ratios and higher forecasted growth values.
Russell 1000 Index (Russell 1000): Measures the performance of the 1,000 largest companies in the Russell 3000 Index. Frank Russell Co. ranks the US common stocks from largest to smallest market capitalization at each annual reconstitution period. The Russell 1000 Index represents the vast majority of the total market capitalization of the Russell 3000 Index. It is considered to be generally representative of US Equity Large Cap performance.
Russell 1000 Value Index (R1000 Value): Measures the performance of the Russell 1000 companies with lower price-to-book ratios and lower forecasted growth values
Russell 2000 Growth Index (R2000 Growth): Measures the performance of those Russell 2000 companies with higher priceto-book ratios and higher forecasted growth values.
Russell 2000 Index (Russell 2000): Measures the performance of the 2,000 smallest companies in the Russell 3000 Index. Frank Russell Co. ranks the US common stocks from largest to smallest market capitalization at each annual reconstitution period. The Russell 2000 Index represents a very small percentage of the total market capitalization of the Russell 3000 Index. It is considered to be generally representative of US Equity Small and Mid Cap performance.
Russell 2000 Value Index (R2000 Value): Measures the performance of those Russell 2000 companies with lower price-tobook ratios and lower forecasted growth values Russell 3000 Growth: The Russell 3000 Growth Index measures the performance of the broad growth segment of the U.S. equity universe. It includes those Russell 3000 Index companies with higher price-to-book ratios and higher forecasted growth values.
Russell 3000 Index (Russell 3000): Measures the performance of the 3,000 largest US companies based on total market capitalization, which represents nearly the entire market capitalization of the investable US equity market. Frank Russell Co. ranks the US common stocks from largest to smallest market capitalization at each annual reconstitution period. Russell 3000 Value: The Russell 3000 Value Index measures the performance of the broad value segment of U.S. equity value universe. It includes those Russell 3000 Index companies with lower price-to-book ratios and lower forecasted growth values.
Russell Midcap Growth Index (Russell Midcap Growth): Contains those Russell Midcap (800) securities with a greater thanaverage growth orientation. Companies in this index tend to exhibit higher price-to-book and price-earnings ratios, lower dividend yields and higher forecasted growth values than the Value universe.
Russell Midcap Index (Russell Midcap): Measures the performance of the mid-cap segment of the US equity universe. The Russell Midcap Index includes the smallest 800 securities in the Russell 1000.
Russell Midcap Value Index (Russell Midcap Value): Contains those Russell Midcap (800) securities with a less-than average growth orientation. Securities in this index generally have lower price-to-book and price-earnings ratios, higher dividend yields and lower forecasted growth values than the Growth universe. S&P 500 Index: The S&P 500 Index consists of 500 stocks chosen for market size, liquidity, and industry group representation. It is a market value weighted Index (stock price times number of shares outstanding), with each stock’s weight in the Index proportionate to its market value. The Index is one of the most widely used benchmarks of US Equity Large Cap performance.
S&P 500 Sector/Consumer Discretionary Index: The S&P 500 Sector/Consumer Discretionary Index consists of stocks chosen for their representation in the Consumer Discretionary industry. The companies in the index tend to be the most sensitive to economic cycles. Manufacturing companies include automotive, household durable goods, textiles and apparel, and leisure equipment. Service companies include hotels, restaurants/leisure facilities, media production and services, consumer retailing and services and education services. It is a market value weighted Index (stock price times number of shares outstanding), with each stock’s weight in the Index proportionate to its market value. S&P 500 Sector/Consumer Staples Index: The S&P 500 Sector/Consumer Staples Index consists of stocks chosen for their representation in the Consumer Staples industry. The companies in the index tend to be the less sensitive to economic cycles. They include manufacturers and distributors of food, beverages and tobacco, and producers of non-durable household goods and personal products; also food and drug retailing companies. It is a market value weighted Index (stock price times number of shares outstanding), with each stock’s weight in the Index proportionate to its market value.
S&P 500 Sector/Energy Index: The S&P 500 Sector/Energy Index consists of stocks chosen for their representation in the Energy industry. The companies in the index are dominated by either the construction for provision of oil rigs, drilling equipment and other energy-related service and equipment or the exploration, production, marketing, refining and/or transportation of oil and gas products, coal and consumable fuels. It is a market value weighted Index (stock price times number of shares outstanding), with each stock’s weight in the Index proportionate to its market value.
S&P 500 Sector/Financials TR Index: The S&P 500 Sector/Financials Index consists of stocks chosen for their representation in the Financials industry. The companies in the index are involved in activities such as banking, consumer finance, investment banking and brokerage, asset management, insurance and investments, and real estate, including REITs. It is a market value weighted Index (stock price times number of shares outstanding), with each stock’s weight in the Index proportionate to its market value.
S&P 500 Sector/Healthcare TR Index: The S&P 500 Sector/Healthcare Index consists of stocks chosen for their representation in the Healthcare industry. The companies in the index are involved in health care equipment and supplies, health care-related services, or in the research, development, production and marketing of pharmaceuticals and biotechnology products. It is a market value weighted Index (stock price times number of shares outstanding), with each stock’s weight in the Index proportionate to its market value.
S&P 500 Sector/Industrials TR Index: The S&P 500 Sector/Industrials Index consists of stocks chosen for their representation in the Industrials industry. Companies include those that manufacture and distribute capital goods (i.e. aerospace/defense, construction, engineering and building products, electrical equipment and industrial machinery); provide commercial services and supplies (i.e. printing, employment, environmental/office services); or provide transportation services (i.e. airlines, couriers, marine, road/rail and transportation infrastructure). It is a market value weighted Index (stock price times number of shares outstanding), with each stock’s weight in the Index proportionate to its market value.
S&P 500 Sector/Information Technology TR Index: The S&P 500 Sector/Information Technology Index consists of stocks chosen for their representation in the Info Tech industry. Companies considered are involved in technology software and services and technology hardware and equipment. It is a market value weighted Index (stock price times number of shares outstanding), with each stock’s weight in the Index proportionate to its market value.
S&P 500 Sector/Materials TR Index: The S&P 500 Sector/Materials Index consists of stocks chosen for their representation in the Materials industry. These include companies that manufacture chemicals, construction materials, glass, paper, forest products and related packaging products, metals, minerals and mining companies, including steel producers. It is a market value weighted Index (stock price times number of shares outstanding), with each stock’s weight in the Index proportionate to its market value.
S&P 500 Sector/Telecommunication Services TR Index: The S&P 500 Sector/Telecom Services Index consists of stocks chosen for their representation in the Telecom industry. The companies in the index are involved in health care equipment and supplies, health care-related services, or in the research, development, production and marketing of pharmaceuticals and biotechnology products. It is a market value weighted Index (stock price times number of shares outstanding), with each stock’s weight in the Index proportionate to its market value.
S&P 500 Sector/Utilities TR Index: The S&P 500 Sector/Utilities Index consists of stocks chosen for their representation in the Utilities industry. Companies considered include electric, gas or water utilities, or companies that operate as independent producers and/or distributors of power. It is a market value weighted Index (stock price times number of shares outstanding), with each stock’s weight in the Index proportionate to its market value.
S&P/LSTA Leveraged Loan TR: The S&P/LSTA U.S. Leveraged Loan 100 Index is designed to reflect the performance of the largest facilities in the leveraged loan market. Yield Index but caps issuer exposure at 2%. Index constituents are capitalization-weighted, based on their current amount outstanding, provided the total allocation to an individual issuer does not exceed 2%. Issuers that exceed the limit are reduced to 2% and the face value of each of their bonds is adjusted on a pro-rata basis. Similarly, the face values of bonds of all other issuers that fall below the 2% cap are increased on a pro-rata basis. In the event there are fewer than 50 issuers in the Index, each is equally weighted and the face values of their respective bonds are increased or decreased on a pro rata basis.
The success of an investment program may be affected by general economic and market conditions, such as interest rates, availability of credit, inflation rates, economic uncertainty, changes in laws and national and international political circumstances. These factors may affect the level and volatility of securities prices and the liquidity of a portfolio’s investments. Unexpected volatility or illiquidity could result in losses.
Investing in securities is speculative and entails risk. There can be no assurance that one’s investment objectives will be achieved or that an investment strategy will be successful. Significant losses could result if a strategy involves the use leverage, short sales and derivative transactions, investment in foreign or illiquid securities, and potentially limited diversification. Past performance is not a guarantee of future results.
For fixed income securities, there is a risk that the price of these securities will go down as interest rates rise. Another risk of fixed income securities is credit risk, which is the risk that an issuer of a bond will not be able to make principal and interest payments on time. Liquidity risk is the risk that you might not be able to buy or sell investments quickly for a price that is close to the true underlying value of the asset. When a bond is said to be liquid, there's generally an active market of investors buying and selling that type of bond. High yield fixed income securities are considered to be speculative and involve a substantial risk of default. Adverse changes in economic conditions or developments regarding the issuer are more likely to cause price volatility for issuers of high yield debt than would be the case for issuers of higher grade debt securities.
Special Risks of Foreign Securities
Investments in foreign securities are affected by risk factors generally not thought to be present in the US. The factors include, but are not limited to, the following: less public information about issuers of foreign securities and less governmental regulation and supervision over the issuance and trading of securities.
Special Risks of Small Market Capitalization Securities
Investments in companies with smaller market capitalization are generally riskier than investments in larger, well-established companies. Smaller companies often are more recently formed than larger companies and may have limited product lines, distribution channels and financial and managerial resources. These companies may not be well known to the investing public, may not have significant institutional ownership and may have cyclical, static or moderate growth prospects. There is often less publicly available information about these companies than there is for larger, more established issuers, making it more difficult for the Investment Manager to analyze that value of the company. The equity securities of small and mid-capitalization companies are often traded over-the-counter or on regional exchanges and may not be traded in the volume typical for securities that are traded on a national securities exchange. Consequently, the Investment Manager may be required to sell these securities over a longer period of time (and potentially at less favorable prices) than would be the case for securities of larger companies. In addition, the prices of the securities of small and midcapitalization companies may be more volatile that those of larger companies.
Special Risks of Master Limited Partnerships
Master limited partnerships (MLPs) are publicly listed securities that trade much like a stock, but they are taxed as partnerships. MLPS are typically concentrated investments in assets such as oil, timber, gold and real estate. The risks of MLPS include concentration risk, illiquidity, exposure to potential volatility, tax reporting complexity, fiscal policy and market risk. MLPS are not suitable for all investors.
© 2020 All rights reserved. This report is intended for informational purposes only. All information provided and opinions expressed are subject to change without notice. The information and statistical data contained herein have been obtained from sources we believe to be reliable. No part of this report may be reproduced in any manner without the written permission of Oppenheimer Asset Management or any of its affiliates. Any securities discussed should not be construed as a recommendation to buy or sell and there is no guarantee that these securities will be held for a client’s account nor should it be assumed that they were or will be profitable. The Consulting Group is a division of Oppenheimer Asset Management. Oppenheimer Asset Management is the name under which Oppenheimer Asset Management Inc. (“OAM”) does business. OAM is an indirect, wholly owned subsidiary of Oppenheimer Holdings Inc., which is also the indirect parent of Oppenheimer & Co. Inc. (“Oppenheimer”). Oppenheimer is a registered investment adviser and broker dealer. Securities are offered through Oppenheimer. 5943528.1