Beyond the Bear
- May 14, 2020
Bear markets come and go. So will this one.
The record-breaking bull market that lasted from the 2008-2009 financial crisis through the end of the past decade is over. The S&P 500 peaked on Feb. 19, 2020 and then the bear market began. Aa bear market is typically defined as a 20% decline in the broad market. Going through a bear market is never fun. It’s often painful and filled with lots of anxiety. There is no telling how long this current bear market will last. However, we know that it will end eventually just like every other bear market in history. The key is to not miss the changing tide when it turns into the next bull market.
While the coronavirus-fueled drawdown may be a new dynamic causing a bear market, in our opinion, this bear market is no different than prior bear markets. When this bear market will end will likely depend on the effectiveness of the medical and policy response to the virus itself and the economic disruption it has caused.
A History of Bear Markets
Let’s put the current market environment in historical context. Since 1929, there have been 10 bear markets. The shortest among them was the 34% drop that lasted three months during the crash of 1987. The bear market with the largest decline and longest duration was from September 1929 to June 1932. This was the 86.2% drawdown, also known as the Great Depression, which lasted nearly 33 months. Overall, the average bear market lasts 17.2 months and declines 40.1%.
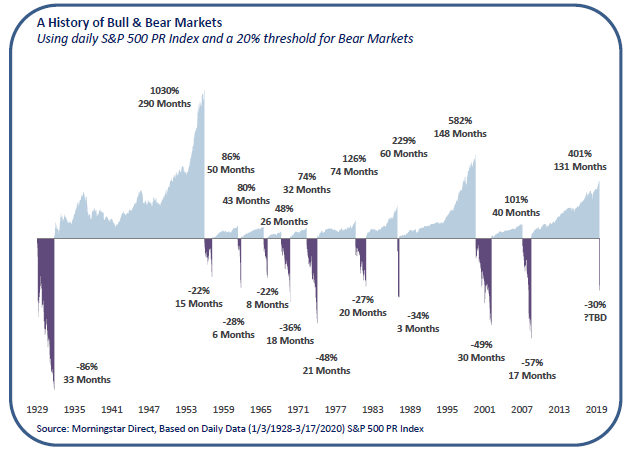
Bear markets have varying declines and durations. They also have varying times to recovery (length of time to regain prior peak.)
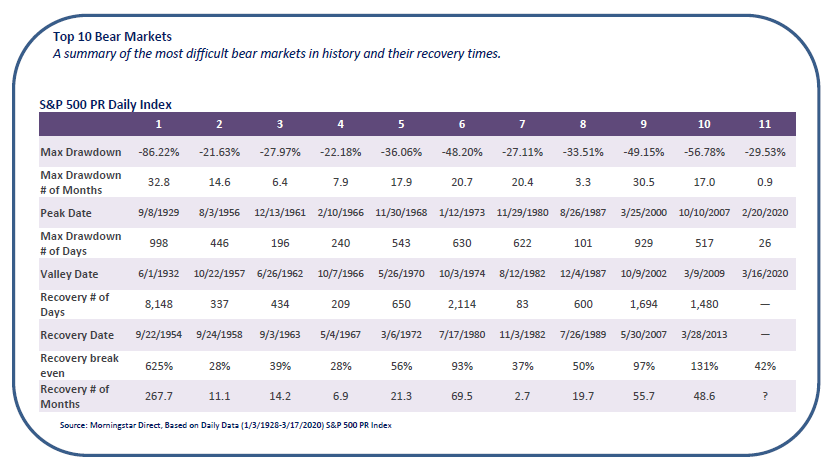
The current virus-induced drawdown resulted in the fastest-ever drop of 20% or greater for the S&P 500). It was only a 16 day period from its historic high reached on February 19, 2020 to hitting bear market levels on March 12, 2020. Additionally, volatility, as measured by the CBOE Volatility Index, hit a high level of 82.7 on March 16, 2020 as the S&P 500 rose or fell at least 4% in a record setting number of consecutive sessions. The last time the CBOE Volatility Index hit a level so high was during the financial crisis in October 2008 when the index hit 80.9. The average number of months for the past ten bear markets to return to their prior peak was 51 months.
As we entered this bear market, the economic outlook was good and improving, as opposed to deteriorating. The bear market hit suddenly and at a record pace. Additionally, there has been a lot of monetary and fiscal stimulus put into place, also at a fast pace. As a result, we feel that the recovery could occur at a faster than normal pace with a swift and effective response to get the coronavirus under control. Additionally, as we continue our journey through this unprecedented time, it is hard to argue against the notion that stocks are becoming more attractively valued. Since the market peak on February 19, 2020 through March 30, 2020 stocks have become 20% cheaper (19xvs. 15.2 based on the one-year forward-looking P/E ratio.) That is a fairly steep decline in a short amount of time. While stocks can certainly become cheaper, for those with a long-term investment horizon this could be a good entry point and/or an opportune time to rebalance.
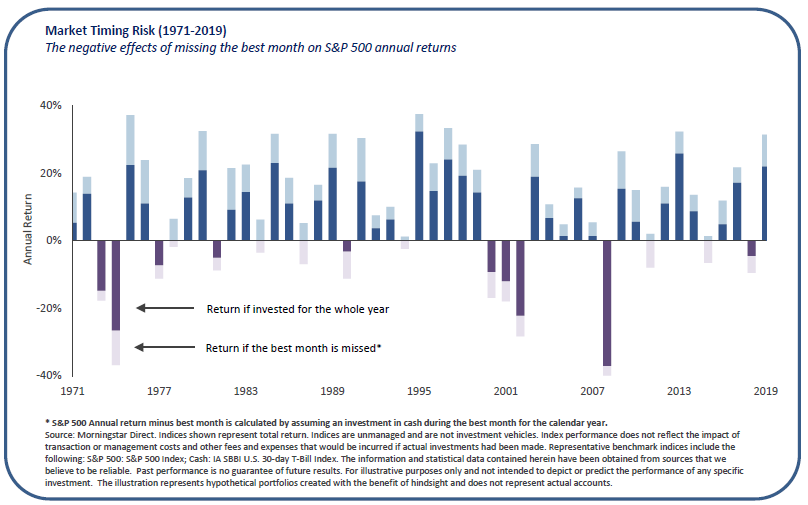
Lastly, as a long-term investor, don’t cash out of your investments, sit on the sidelines and wait it out. While this may give peace of mind in the short term, there is an opportunity cost in the long term. Missing out on the best month of a given year has a big opportunity cost in terms of missing a meaningful percentage of the year’s investment return. As a long-term investor, we believe it’s prudent to stick to your plan by maintaining diversification and an asset allocation that has been set for you based on your goals and constraints while rebalancing when appropriate. Like all bear markets, this one will come to an end. If you stay invested, then you won’t miss the rebound.
Our Views
It is likely that the United States will hit a recession as a result of widespread shutdowns as people are confined to their homes in an effort to curb contagion. . There is no telling how long it will take to “flatten the curve” so life can get back to normal. The longer it takes to stem the spread of the virus, the longer the recession could last. When there is an end in sight, there is a chance that there will be a sharp recovery as the economy reboots. It’s too soon to tell whether it will be a V-shaped or U-shaped recovery. Meanwhile, stock valuations, have become much more attractive. Therefore, in our opinion, risk assets will provide a modest real rate of return while defensive assets, which have performed well amidst the drawdown, could take a back seat as they may have become overvalued in the flight to safety that occurred in late February and March.
While a recession is most likely on the horizon, we believe the market has already priced it in. Given monetary and fiscal measures put in place to help stabilize the economy, it seems like the market is now looking to price in a recovery in the second half of 2020. However, the market lows could be retested if the recovery is pushed out further due to efforts to contain the pandemic taking longer than expected. We will continue to monitor the potential impact of the coronavirus on various geographies, national and local economies and ongoing monetary and fiscal policy responses.
Asset Class Detail
The Multi-Strategy Asset Group’s sector-specific opinions are derived from ongoing analysis of valuations, momentum, economics, business cycle and fund flows. The Asset Class Detail section summarizes our views within and across asset classes.
Global Equity
Volatility caused by the coronavirus pandemic has pushed valuations below long-term averages. Earnings expectations have been declining due to expectations of a global slowdown. The Fed has been providing underlying valuation support by cutting interest rates. We expect energy, industrials and materials to be impacted most during this slowdown. We expect growth sectors to hold up best while value-oriented sectors trade at extreme discounts. We therefore recommend a balance of growth and value. Long/short equity strategies should benefit from an increasingly bifurcated equity market and potentially dampen volatility during market downturns through alpha short positions and portfolio management.
Current View: Positive
Change: Increase
(change from prior quarter)
Valuations are reasonable on a relative spread basis given low interest rates. With a recession being more of a concern due to the virus-induced slowdown, small-cap stocks face a lot of uncertainty. If the slowdown is short-lived, we expect small cap stocks to benefit. Long/short strategies may also capitalize on heightened volatility among small caps. Late-stage-growth companies that are pre-IPO also provide an interesting exposure to clients as valuations are increasingly attractive.
Current View: Neutral
The valuation gap that existed between the U.S. and non-U.S. developed markets has eroded this year as U.S. growth expectations and stock prices declined. Additionally, we’re not confident that Europe and Japan are well-equipped to weather a global slowdown. These economies are already in a negative rate environment and are not as insulated as the United States slowing global growth. We favor Small-cap exposure for enhanced alpha and diversification.
Current View: Neutral
Change: Decrease
(change from prior quarter)
While loosening monetary policy in developed markets tends to be favorable for emerging markets and their currencies, we feel that Asia and Latin America are not as well equipped to contain the coronavirus pandemic. Additionally, these markets could be more negatively impacted by slowing global growth as many emerging markets are net exporters. Active management could be especially beneficial in these markets to help avoid trouble spots and capitalize on opportunities.
Current View: Neutral
Change: Decrease
(change from prior quarter)
Global Debt
Treasury yields hit historically low levels after the coronavirus outbreak and the Fed is in now loosening mode. Long- duration bonds pose risks if the global slowdown is short-lived. Conservative investors should maintain a core bond allocation in short-to-intermediate duration, high-quality securities as a tail-risk hedge.
Current View: Slightly Negative
Spreads widened and yields increased. However, there could still be further widening as credit markets have tightened up with less liquidity. We expect to see a number of investment grade rated companies downgraded. As a result, active management in this sector is encouraged.
Current View: Neutral
High yield is experiencing significant spread widening amid the coronavirus-fueled volatility. Energy has seen the most deterioration. This sector could experience additional deterioration if the pandemic shuts down the economy longer than expected. We emphasize the better risk-reward opportunity in short-duration bonds in the higher-quality segments as they will hold up better amid high market volatility.
Current View: Neutral
Exceptionally low yields and continued accommodative central bank monetary policy creates an unattractive backdrop for non-U.S. sovereign debt. Corporate credit is susceptible to a global slowdown and potential recession due to the coronavirus-induced volatility.
Current View: Slightly Negative
The sector continues to offer high absolute yields, attractive valuations, good fundamentals and price potential not found in most richly valued developed markets. Emphasis should be placed on hard currency, U.S. dollar-denominated debt.
Current View: Slightly Positive
Diversifying Strategies
REITs and utility-related segments offer attractive yields and defensive characteristics in the slowing growth, low interest rate environment. Certain real-estate investments have become more attractive following recent tax legislation that provides meaningful tax incentives for investments in designated “opportunity zones.” We maintain a positive outlook on opportunity zone investments as we see significant tax benefits for investment in 2020.
Current View: Slightly Positive
We hold a positive view of fundamental macro strategies that capitalize on current market themes. We have a slightly negative view on managed futures strategies given potential for short-term choppiness, a headwind for trend followers.
Current View: Neutral
We believe catalyst-focused, event-driven strategies are currently attractive given the favorable tax environment and low corporate borrowing rates. However, corporate deal flow has slowed amid the current market volatility.
Current View: Positive
Disclosure
The opinions expressed herein are subject to change without notice. The information and statistical data contained herein has been obtained from sources we believe to be reliable. Past performance is not a guarantee of future results. The above discussion is for illustrative purposes only and mention of any security should not be construed as a recommendation to buy or sell and may not represent all investment managers or mutual funds bought, sold, or recommended for client’s accounts. There is no guarantee that the above-mentioned investments will be held for a client’s account, nor should it be assumed that they were or will be profitable. The Consulting Group is a division of Oppenheimer Asset Management Inc. (OAM). OAM is an indirect, wholly owned subsidiary of Oppenheimer Holdings Inc., which also indirectly wholly owns Oppenheimer & Co. Inc. (Oppenheimer), a registered broker dealer and investment adviser. Securities are offered through Oppenheimer.
For information about the advisory programs available through OAM and Oppenheimer, please contact your Oppenheimer financial advisor for a copy of each firm’s ADV Part 2A.
Adopting a fee-based account program may not be suitable for all investors; anticipated annual commission costs should be compared to anticipated annual fees.
S&P 500 Index measures performance of U.S. large-cap companies.
MSCI AC World ex-USA Index captures large- and mid- cap representation across 22 of 23 developed-market countries (excluding the U.S.) and 24 emerging-market countries.
LTM PE Ratio is the last 12-month price-to-earnings ratio.
Indices are unmanaged, do not reflect the costs associated with buying and selling securities and are not available for direct investment.
Risk Factors
The success of an investment program may be affected by general economic and market conditions, such as interest rates, the availability of credit, inflation rates, economic uncertainty, changes in laws and national and international political circumstances. These factors may affect the level and volatility of securities prices and the liquidity of a portfolio’s investments. Unexpected volatility or illiquidity could result in losses. Investing in securities is speculative and entails risk. There can be no assurance that the investment objectives will be achieved or that an investment strategy will be successful.
Special Risks of Foreign Securities
Investments in foreign securities are affected by risk factors generally not thought to be present in the United States. The factors include, but are not limited to, the following: less public information about issuers of foreign securities and less governmental regulation and supervision over the issuance and trading of securities. International investments may involve risk of capital loss from unfavorable fluctuation in currency values, from differences in generally accepted accounting principles or from economic or political instability in other nations.
Special Risks of Small- and Mid-Capitalization Companies
Investments in companies with smaller market capitalization are generally riskier than investments in larger, well established companies. Smaller companies often are more recently formed than larger companies and may have limited product lines, distribution channels and financial and managerial resources. These companies may not be well known to the investing public, may not have significant institutional ownership and may have cyclical, static or moderate growth prospects. There is often less publicly available information about these companies than there is for larger, more established issuers, making it more difficult for the Investment Manager to analyze that value of the company. The equity securities of small- and mid-capitalization companies are often traded over-the-counter or on regional exchanges and may not be traded in the volume typical for securities that are traded on a national securities exchange. Consequently, the investment manager may be required to sell these securities over a longer period of time (and potentially at less favorable prices) than would be the case for securities of larger companies. In addition, the prices of the securities of small- and mid- capitalization companies may be more volatile than those of larger companies.
Special Risks of Fixed Income Securities
For fixed income securities, there is a risk that the price of these securities will go down as interest rates rise. Another risk of fixed income securities is credit risk, which is the risk that an issuer of a bond will not be able to make principal and interest payments on time. High Yield Fixed Income Risk. High yield fixed income securities are considered to be speculative and involve a substantial risk of default. Adverse changes in economic conditions or developments regarding the issuer are more likely to cause price volatility for issuers of high yield debt than would be the case for issuers of higher grade debt securities. In addition, the market for high yield debt may be less attractive than that of higher-grade debt securities.
Liquidity risk. Liquidity risk is the risk that you might not be able to buy or sell investments quickly for a price that is close to the true underlying value of the asset. When a bond is said to be liquid, there's generally an active market of investors buying and selling that type of bond.
Market risk: Fixed income securities markets are subject to many factors, including economic conditions, government regulations, market sentiment, and local and international political events. Further, the market value of fixed-income securities will fluctuate depending on changes in interest rates, currency values and the creditworthiness of the issuer.
Special Risks of Master Limited Partnerships Master limited partnerships are publicly listed securities that trade much like a stock, but they are taxed as partnerships. MLPs are typically concentrated investments in assets such as oil, timber, gold and real estate. The risks of MLPs include concentration risk, illiquidity, exposure to potential volatility, tax reporting complexity, fiscal policy and market risk. MLPs are not suitable for all investors. 3038859.1