Asset Management
Pullbacks Are Normal — And the Calendar Often Turns
October 13, 2026

Of the four years in a presidential cycle, midterm years have historically produced the largest average intra-year decline for the S&P 500. Looking across every midterm year since World War II, the market's average peak-to-trough drawdown has been roughly 16%, deeper than any other year of the cycle. Read that in isolation and it sounds alarming. Read it alongside what typically follows and it looks different: in the twelve months after those lows, the index has historically produced strong average gains.
There’s an important limitation: nobody rings a bell at the low. These figures are measured from the bottom in hindsight, which is not a place anyone can reliably identify in real time, precisely the argument against trying to trade around it.
The calendar itself also tends to shift in midterm years. January and April have often been among the market's stronger months historically. Midterm years frequently break that rhythm: returns have tended to soften through the summer and early fall as investors weigh the potential impact of political change, then firm up later in the year as polling clarifies the likely outcome. Some of the strongest gains in past midterm years have historically come in October and November.
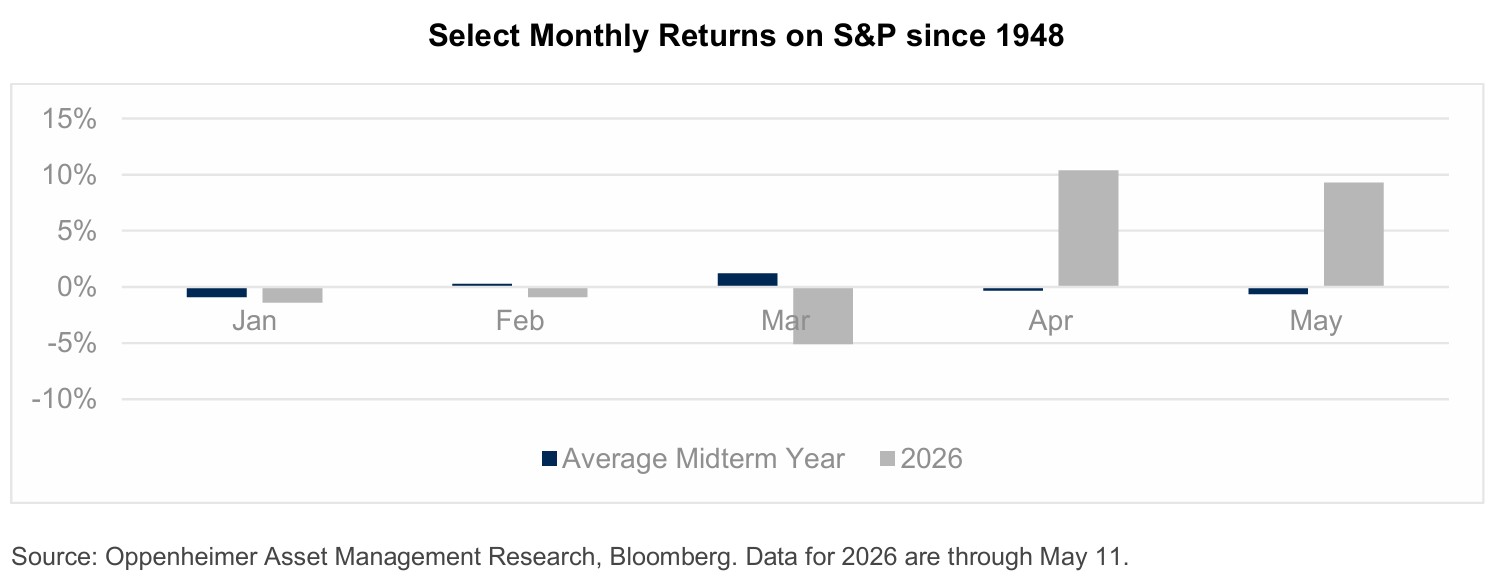
Markets have appeared to respond less to which party wins and more to the simple reduction of uncertainty once the outcome becomes clearer. A necessary caveat: these are averages drawn from roughly two dozen election cycles, and individual years vary. In fact, 2026 is a live example, as the pattern has not held particularly well so far.
The more useful takeaway is simpler: a double-digit decline at some point during a midterm year has historically been the norm, not the exception. Knowing that in advance is what makes it possible to sit still.
For additional insights on the upcoming midterm elections and potential market implications from Oppenheimer's Chief Investment Officer, click here to read.
This material is provided for informational purposes only and is not a recommendation as defined in Regulation Best Interest adopted by the U.S. Securities and Exchange Commission. It does not constitute a recommendation to buy or sell any security or to adopt any investment strategy. The views expressed are those of the author and may not reflect the views of Oppenheimer & Co. Inc. or its affiliates.
The S&P 500 Index is an unmanaged, capitalization-weighted index of 500 leading U.S. large-cap companies. It is not possible to invest directly in an index. Index performance is shown for illustrative purposes only, assumes reinvestment of dividends, and does not reflect fees, expenses, or taxes.
Historical market patterns, returns, and correlations discussed herein are for illustrative purposes only and may not be indicative of future results. Observed relationships between market performance and election cycles are based on historical correlations and do not imply causation. Past performance does not guarantee future results.
Investing in securities involves risk, including the possible loss of principal. There is no assurance that any investment strategy will be successful.
Oppenheimer & Co. Inc. is a registered broker-dealer and investment adviser and an indirect wholly owned subsidiary of Oppenheimer Holdings Inc. Member SIPC. 9099130.1
