Asset Management
The Midterm Election Effect On Markets
June 16, 2026
Investors often search for patterns in the market the way travelers look for weather forecasts before a long trip. One of Wall Street’s most closely watched seasonal patterns is the so-called “midterm effect”—the tendency for stocks to experience weaker and more volatile returns during U.S. midterm election years before often recovering after Election Day. Importantly, this pattern has not historically rewarded attempts to step out of the market ahead of elections and re-enter later.
But while history can provide useful clues, it does not provide guarantees. Markets are shaped by far more than politics alone, and every election cycle comes with its own unique economic and geopolitical backdrop.
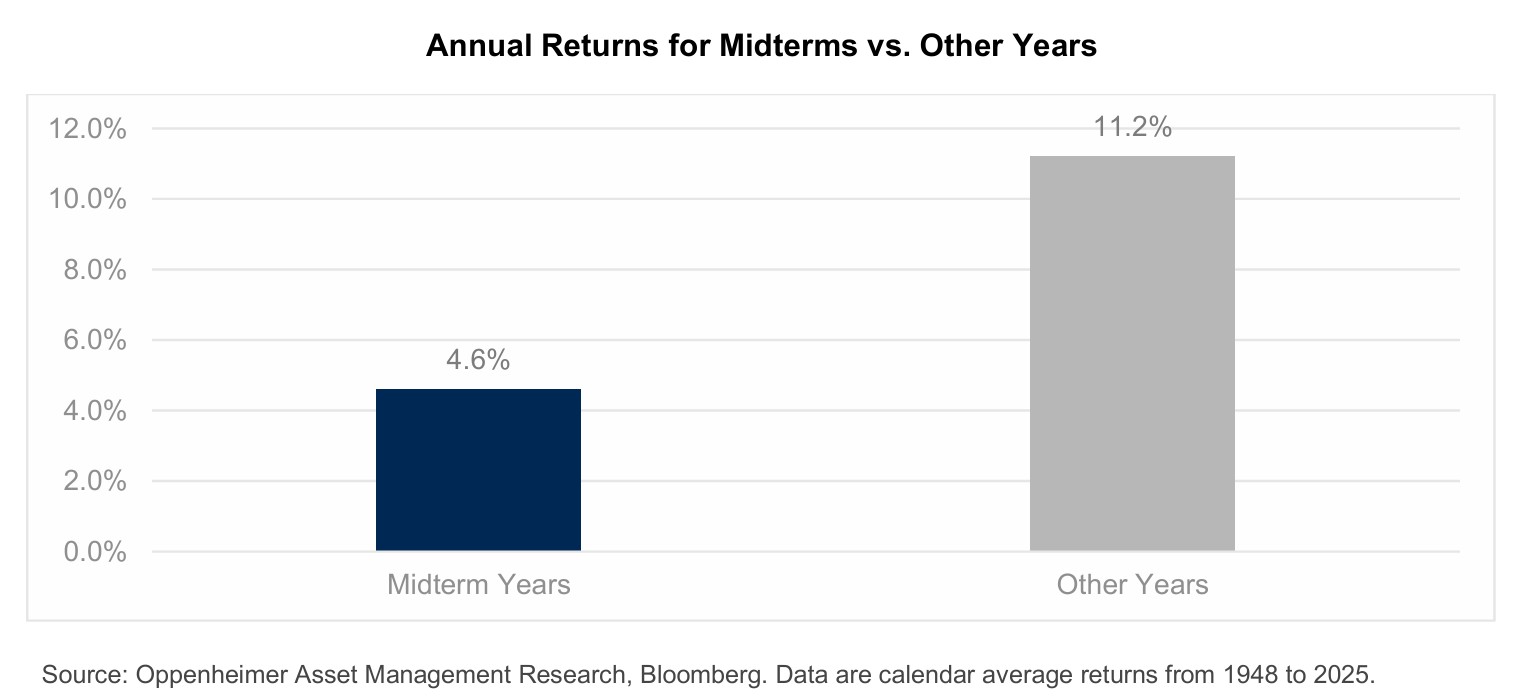
Since 1948, years featuring a U.S. midterm election for Congress have produced an average annual gain of 4.6% for the S&P 500, compared with an average gain of 11.2% during the other three years of the presidential cycle.
Years that feature a midterm election tend to have lower returns and higher volatility than the other three years of the election cycle.
The tendency for markets to experience more volatility and weaker returns leading up to midterm elections is commonly referred to as “the midterm effect.”
The reasoning is fairly intuitive: the party controlling the White House often loses Congressional seats during midterm elections, creating uncertainty around taxes, spending priorities, regulation, and the broader legislative agenda. And markets tend to dislike uncertainty the way drivers dislike heavy fog—investors often slow down when visibility becomes limited.
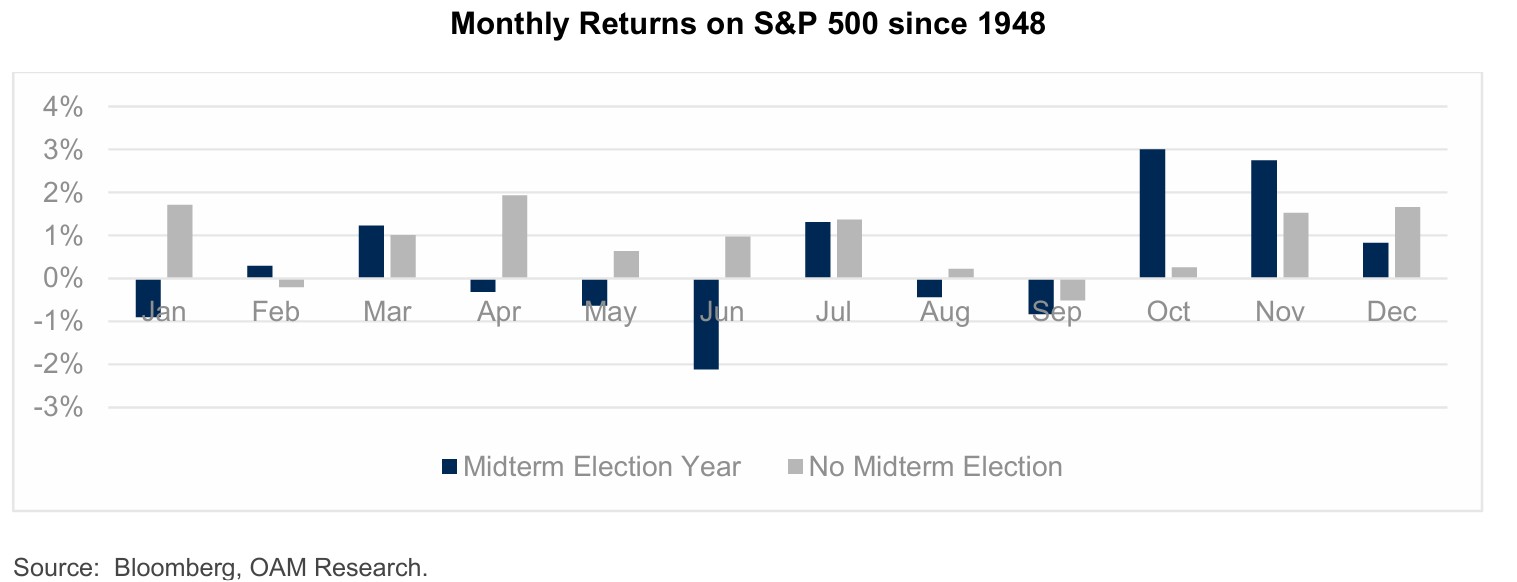
Market returns typically follow seasonal patterns throughout the year. Historically, January and April have often been stronger months for equities, supported in part by new investment contributions and tax refund season.
But midterm election years frequently break that rhythm.
Historically, returns during midterm years have tended to soften through the summer and early fall as investors weigh the potential impact of political change. Then, as polling begins to clarify the likely outcome, markets have often regained confidence later in the year.
In fact, the strongest gains during many midterm years have historically occurred in October and November.
Monthly stock returns have a seasonal pattern that is different in the years that feature a midterm election than those of the other three years.
The pattern suggests that markets may respond less to which party wins and more to the simple reduction of uncertainty once the election outcome becomes clearer.
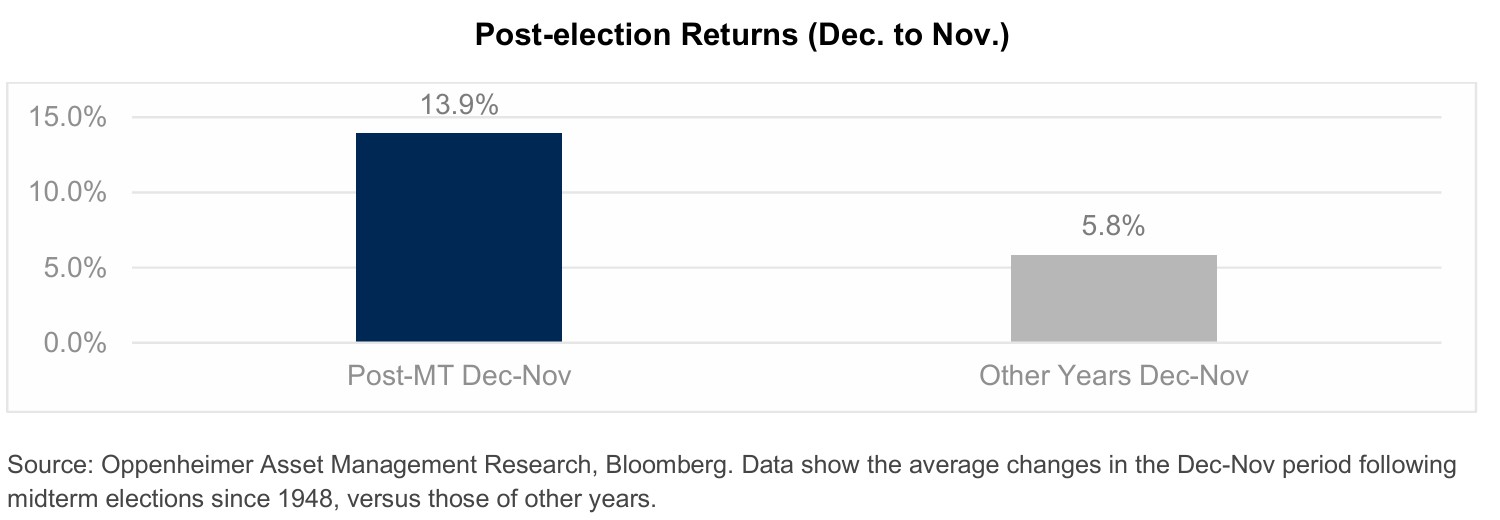
Historically, the period following midterm elections has often been much stronger for investors.
Since 1948, the S&P 500 has risen an average of 13.9% during the twelve months following a midterm election, compared with an average gain of 5.8% during the comparable periods of non-midterm years.
The twelve-month period following a midterm election tends to bring stronger returns than the same periods of the other three years of the US election cycle.
Once elections are behind them, investors typically have greater visibility into the political and policy environment ahead. Markets often prefer clarity—even if the outcome itself is imperfect— over prolonged uncertainty.
Of course, history does not repeat perfectly. But the consistency of stronger post-midterm returns has made this one of the more closely followed patterns in market history.
Thus far, 2026 has not behaved like a “typical” midterm election year.
Why might that be?
While midterm years have historically coincided with weaker returns earlier in the year, markets are influenced by many other forces at the same time. In 2026, concerns surrounding the conflict with Iran and the resulting energy price shock likely overshadowed election-related uncertainty.
Thus far in 2026, monthly returns over the first four and a half months have been atypical of a midterm election year, suggesting that these patterns do not always hold in each and every election cycle. Other factors have likely trumped the midterm effect.
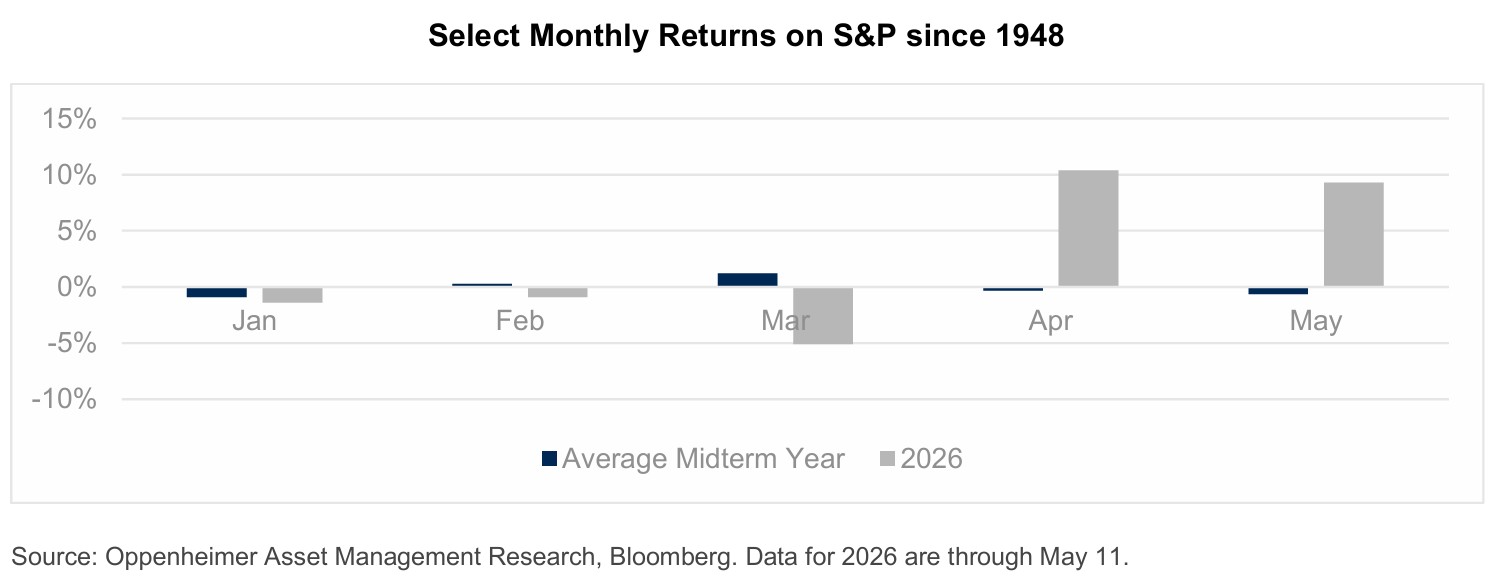
At the same time, strong corporate earnings from S&P 500 companies helped support investor sentiment during the spring months.
In other words, election cycles may influence investor behavior around the margins, but they are rarely the only force driving markets.
While 2026 has already demonstrated that no election cycle follows a perfect historical script, the broader lesson may be less about politics and more about investor discipline. For long-term investors, the key lesson is not to avoid midterm election years, but to remain focused on time in the market rather than timing the market. Periods of uncertainty can feel uncomfortable in real time. Headlines become louder, volatility rises, and the temptation to react emotionally increases. Yet history suggests that some of the strongest market periods have often followed moments of peak uncertainty.
We cannot say with certainty whether markets will continue to rally into late 2026 and 2027. Historically, investors who stayed invested through periods of uncertainty—including election cycles—have often been better positioned to participate in subsequent recoveries, though naturally this cannot be guaranteed.
OAM’s current market views continue to reflect a constructive outlook toward equities, while recognizing that market conditions may change. With bond prices lower and yields higher than earlier this year, fixed income may also present opportunities for investors seeking current income and portfolio diversification, depending on individual objectives, risk tolerance and financial circumstances.
From a sector perspective, OAM is currently monitoring areas such as information technology, communication services, industrials, financials, and consumer discretionary. These views are subject to change and should not be interpreted as a recommendation to buy, sell, or overweight any sector, security, or investment strategy.
Stay tuned.
This information is not a comprehensive resource of all requirements and is not intended as legal, tax, or other professional advice. The information contained herein is general in nature, has been obtained from sources believed to be reliable, and is subject to change based on updates to the Internal Revenue Code, securities laws, and other applicable regulations. Neither Oppenheimer & Co. Inc. nor any of its employees or affiliates provides legal or tax advice. Please consult your legal or tax advisor regarding your specific situation.
This material is not a recommendation as defined in Regulation Best Interest adopted by the U.S. Securities and Exchange Commission and is provided for informational purposes only. It does not constitute a recommendation to buy or sell any security or to adopt any investment strategy. The views expressed are those of the authors and may not reflect the views of Oppenheimer & Co. Inc. or its affiliates.
The S&P 500 Index is an unmanaged, capitalization-weighted index of 500 leading U.S. large-cap companies. It is not possible to invest directly in an index. Index performance is shown for illustrative purposes only, assumes reinvestment of dividends, and does not reflect fees, expenses, or taxes.
Historical market patterns, returns, and correlations discussed herein are for illustrative purposes only and may not be indicative of future results. Observed relationships between market performance and election cycles are based on historical correlations and do not imply causation. Past performance does not guarantee future results.
Data referenced in this material are based on information compiled by Bloomberg and Oppenheimer Asset Management research. Unless otherwise noted, returns reflect calendar-year total returns of the S&P 500 Index from 1948 through 2025. Any 2026 data referenced are partial-year figures through May 11, 2026, and are not indicative of full-year results. Charts and graphs are provided for illustrative purposes only.
This material may contain forward-looking statements that are subject to risks and uncertainties. Actual results may differ materially due to a variety of factors, including changes in market conditions, economic developments, geopolitical events, and other unforeseen circumstances.
Investing in securities involves risk, including the possible loss of principal. There is no assurance that any investment strategy will be successful. Diversified strategy investments such as natural resources, commodities, futures, and real estate investment trusts (REITs) involve varying degrees of risk and may not be suitable for all investors. Investors should consider their financial situation, objectives, and risk tolerance before investing.
Oppenheimer & Co. Inc. (Oppenheimer), a registered broker-dealer and investment adviser, is an indirect wholly owned subsidiary of Oppenheimer Holdings Inc. Securities are offered through Oppenheimer. If you select advisory services offered by Oppenheimer or its affiliate, Oppenheimer Asset Management Inc. (OAM), the respective entity will act in an advisory capacity; otherwise, Oppenheimer may act as a broker-dealer in connection with transactions. For additional information regarding brokerage and advisory services, please visit www.oppenheimer.com or contact your Oppenheimer Financial Professional. Trust services are provided by Oppenheimer Trust Company of Delaware, an affiliate of Oppenheimer.
© 2026 Oppenheimer & Co. Inc. Transacts Business on All Principal Exchanges and Member SIPC. All rights reserved. No part of this brochure may be reproduced in any manner without the written permission of Oppenheimer. 8952938.1
