Asset Management
April Volatility: Implications for Fixed Income Investors
May 07, 2025
After a first quarter marked by federal budget policy noise and stubborn inflation, markets stepped into an even more eventful April. Historically, the key factors that drive 10-year Treasury yields include payroll data (a proxy for labor market strength), inflation readings (Fed favorite PCE), followed by purchasing manager surveys, income trends, home sales, and consumer sentiment. But in an unusual twist, this time it was not macroeconomic data that moved markets—it was trade policy action out of Washington.
Following the April 2nd tariff announcement, markets experienced a sharp spike in volatility across asset classes. Two key measures reflected this shift:
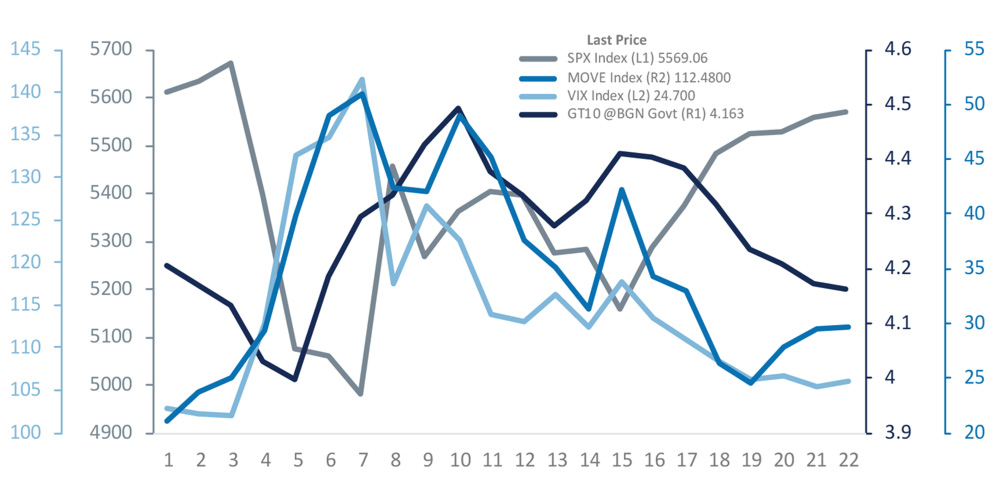
If those market reactions reflected Wall Street’s immediate response to the policy shock, Main Street’s sentiment was captured in the advance estimate of first-quarter real GDP, released on the final day of the month.
Using the classic GDP equation—GDP = C + I + G + (X – M), where:
GDP contracted by 0.3%. While this number will likely be revised in the second (May 29) and third (June 26) releases by the U.S. Bureau of Economic Analysis, the more interesting takeaway was the breakdown: imports increased sharply, indicating that businesses rushed to front-run expected tariff hikes—adding to the volatility of the trade balance component.

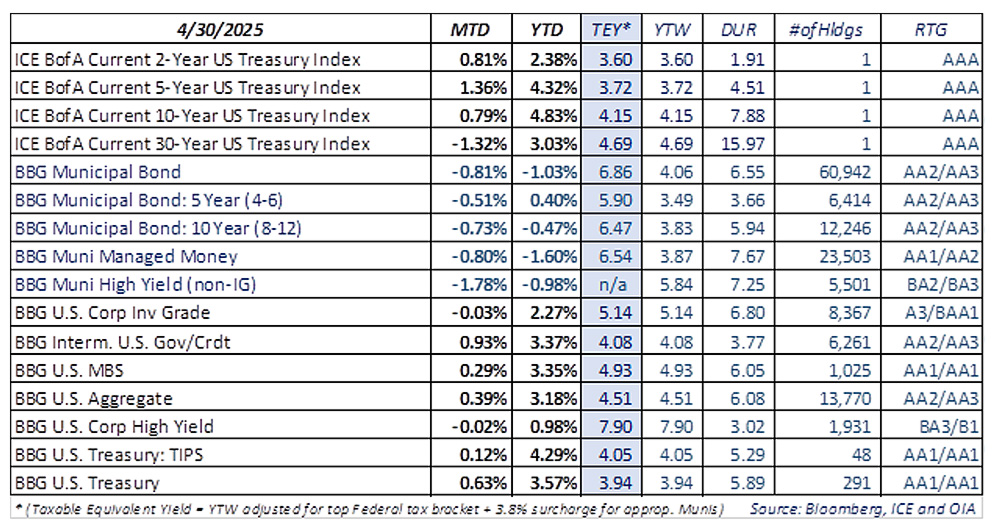
Reference yield changes for the month:
Reference Risk/Return snapshot for the month
According to Federal Reserve officials, tariffs pose both upside risks to inflation and downside risks to growth—which makes the future path for interest rates increasingly difficult to forecast. That same uncertainty has crept into investor behavior: markets are increasingly treating each data release as “old news,” reacting instead to policy headlines and geopolitical developments.
One particularly notable dynamic after April 2 was the temporary breakdown in the typical negative correlation between stocks and bonds. Treasury yields, which usually move in the opposite direction of equities, initially fell as expected during the first 48 hours—reflecting a flight to safety. However, in the following week, a wave of unwinding in the basis trade (a leveraged hedge fund arbitrage strategy between Treasuries and swap spreads), combined with a simultaneous liquidity crunch, pushed Treasury yields sharply higher while equity markets plunged.
This is highly uncharacteristic behavior for a risk-free asset class. It reflects heightened investor uncertainty around the U.S. Dollar’s long-term role as the global reserve currency—and the behavior of traditional safe haven assets like Treasuries.
Our taxable fixed income desk continues to emphasize the importance of central bank independence in anchoring long-term inflation expectations. Any erosion in the Fed’s perceived credibility risks pushing long-term rates significantly higher and could gradually reduce demand for dollar-denominated assets at the margin. With trade negotiations expected to stretch over many months and tariffs already in place across a broad swath of goods, consumer and business sentiment remains fragile. While corporate fundamentals are sound for now, credit selection will be critical as markets shift focus to issuer resilience under prolonged uncertainty.
From a municipal bond perspective, the recent underperformance is not a reflection of credit risk, but rather of market structure. The current environment favors trading-oriented strategies, not long-term allocations. When financing and liquidity tighten, municipal pricing tends to lag more liquid, electronically traded, and easily hedged asset classes. For municipal issuers, this environment may result in elevated borrowing costs in the short term, but the yield backup also reflects opportunities for long-term buyers—especially in names with strong fundamentals.
In this uncertain environment, we believe investors may benefit from a hedged approach, making high quality fixed income a compelling allocation as we move through 2025.

Senior Portfolio Manager OIA Tax-Exempt Fixed Income

Senior Portfolio Manager OIA Taxable Fixed Income

Senior Portfolio Manager OIA Taxable Fixed Income
This piece is intended for informational purposes only. All information provided is subject to change. Investing in securities is speculative and entails risk. There can be no assurance that the investment objectives will be achieved or that an investment strategy will be successful Securities are offered through Oppenheimer & Co. Inc., a registered broker-dealer and affiliate of OAM. This material is not a recommendation as defined in Regulation Best Interest adopted by the Securities and Exchange Commission. It is provided to you after you have received Form CRS, Regulation Best Interest disclosure and other materials. Past performance does not guarantee future results. The risks associated with investing in fixed income include risks related to interest rate movements as the price of these securities will decrease as interests rates rise (interest rate risk and reinvestment risk), the risk of credit quality deterioration which is an issuer that will not be able to make principal and interest payments on time (credit or default risk), and liquidity risk (the risk of not being able to buy or sell investments quickly for a price that is close to the true underlying value of the asset). Average credit quality is calculated by considering the proportion of the value of each individual credit rating) lower of Moodys or S&P) and noting it as a percentage of the entire portfolio, thus producing the average credit quality. Adverse changes in economic conditions or developments regarding the issuer are more likely to cause price volatility for issuers of high yield debt than would be the case for issuers of higher grade debt securities. A credit rating is an assessment provided by a nationally recognized statistical rating organization (NRSRO) such as Standard & Poor or Moody's of the creditworthiness of the issuer with respect to debt obligations. Ratings are measured on a scale that generally ranges from AAA/AAA (highest, depending on the rating organization) to C or D (lowest, again, depending upon the rating organization). Quality Distribution is based on a weighted average of strategy accounts. Bond ratings are categorized by the lower of Moody's or S&P. For more information regarding bond ratings on municipal bonds, please visit www.moodys.com/ratings or www.spglobal.com/ratings.
* (Taxable Equivalent Yield = YTW adjusted for top Federal tax bracket + 3.8% surcharge for appropriate Munis). The views expressed herein are those of the authors as of the date indicated and may change without notice. They do not necessarily reflect the opinions of Oppenheimer & Co. Inc. or its affiliates and should not be construed as a firm recommendation or investment advice.
Any forward-looking statements are based on current assumptions, expectations, and market conditions, which are subject to change.
There is no guarantee that any projections or views will be realized.
OAM and Oppenheimer & Co. Inc. are both indirect wholly owned subsidiaries of Oppenheimer Holdings Inc. Securities are offered by Oppenheimer & Co. Inc 7745355.3
