Asset Management
August Volatility Implications for Fixed Income Investors
September 08, 2025
August was marked by weak labor data, slowing growth, tariff pressures, sticky inflation, and renewed concerns about Fed independence. The month opened with a sharp labor shock. Nonfarm payrolls rose just 73k, while revisions to May and June erased 258k jobs—lowering the three-month average from 150k to only 35k. The revision-driven shock triggered a nearly 20 basis point rally across the Treasury curve and even led to the dismissal of the Bureau of Labor Statistics Commissioner by President Trump. (8.30am release this morning (9/5) was +22k for the month, lowering the 3-mo avg to an even lower 28k). On August 7th, reciprocal tariffs took effect. While the inflation impact remains uncertain, markets welcomed greater trade clarity. Inflation data, however, continued to stay firm: Core CPI at 3.1% year-over-year and Core PCE at 2.9%. Attention then shifted to Chair Powell’s last Jackson Hole speech. His remark that “the baseline outlook and shifting balance of risks may warrant adjusting our policy stance” signaled a clear openness to rate cuts at the September 17th FOMC meeting—already a low bar after the labor market revisions. Reference yields moved lower during the month:
Reference Risk/Return snapshot for the month: |
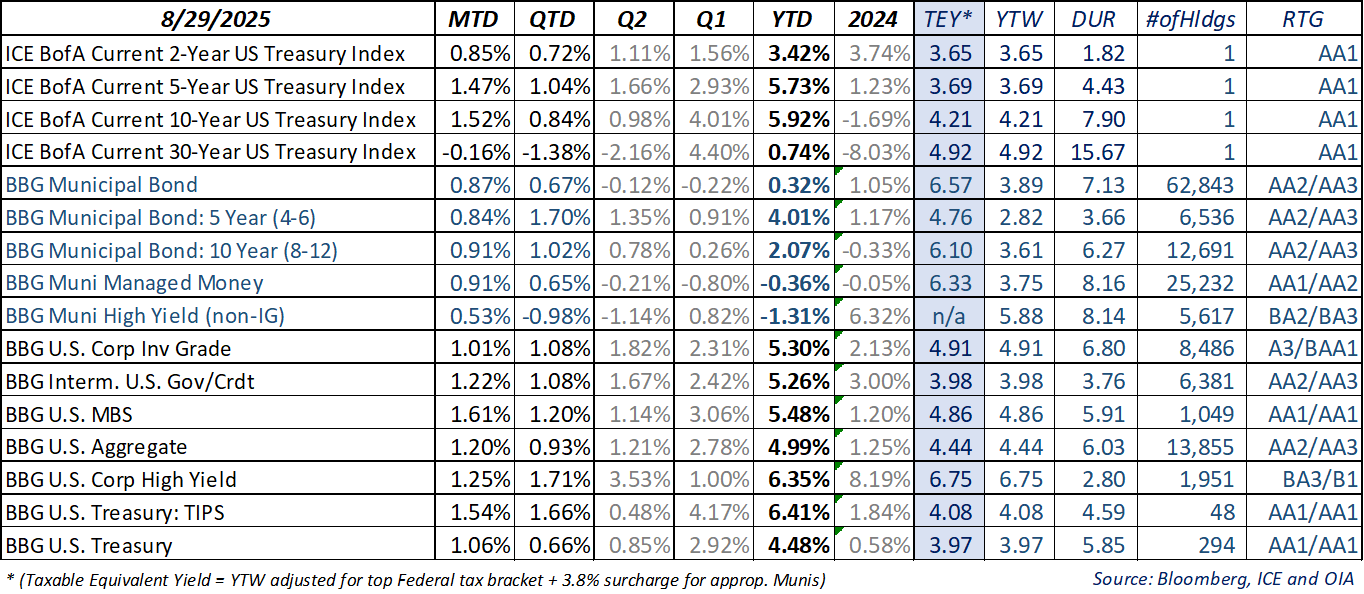
All yield figures represent gross market yields and do not reflect the impact of fees or expenses. Index performance is not indicative of the performance of any particular investment. Indexes are unmanaged and their returns do not take into account any of the costs associated with buying and selling individual securities. Individuals cannot invest directly in an index. Past performance is not indicative of future results.
Labor market weakness now sits firmly at the top of the investors’ wall of worry. Coming into 2025, most expected growth to slow as fiscal support rolled off. That slowdown was naturally compounded by a sharp drop in government hiring. To add to investor concerns, statistical anomalies have also added to the uncertainty: the overly generous BLS “birth-death model,” which estimates jobs from business formation, may miss turning points in economic momentum, resulting in repeated downward revisions.
At the moment, the broader macroeconomic picture remains somewhat mixed. On the restrictive side are weaker growth, sticky inflation, and tariff pass-through risks. On the supportive side are tax cuts and potential AI-related productivity gains. The unemployment rate is steady despite slower payroll growth, largely due to offsetting effects from workforce demographics and immigration.
Amid these cross-currents, we believe the Fed appears to place the greatest weight on labor weakness, waiting to confirm if tariff effects are a one-time price shock or a more lasting problem/issue. That is precisely why a September rate cut now seems to be the baseline scenario as we predicted. Institutional credibility is another key risk. President Trump’s attempt to remove Fed Governor Lisa Cook, now being challenged in court, has heightened concerns about political interference. While the Fed can control the front end of the curve, diminished credibility raises the likelihood of a higher term premium further out. We maintain a steepening bias as a result.
On the taxable side, solid macro and corporate fundamentals, coupled with persistent institutional demand and limited net new supply, have anchored credit spreads and performance. While downside risks have increased, we expect fundamentals and technical factors to remain supportive through year-end. Corporate bond demand remains strong on the back of attractive all-in yields.
On the tax-exempt side; with tax code change risks now solidly behind us and Treasuries rallying, the tone has turned more positive for intermediate maturities. Ten-year taxable equivalent yields remain especially attractive, and while supply has stayed elevated, demand has kept pace.
Bottom line: Even with slower growth and labor momentum, the Treasury rally in anticipation of Fed easing has left intermediate maturity taxable and tax exempt fixed income well positioned to move in lockstep and benefit further.

Senior Portfolio Manager OIA Tax-Exempt Fixed Income

Senior Portfolio Manager OIA Taxable Fixed Income

Senior Portfolio Manager OIA Taxable Fixed Income
This piece is intended for informational purposes only. All information provided is subject to change. Investing in securities is speculative and entails risk. There can be no assurance that the investment objectives will be achieved or that an investment strategy will be successful Securities are offered through Oppenheimer & Co. Inc., a registered broker-dealer and affiliate of OAM. This material is not a recommendation as defined in Regulation Best Interest adopted by the Securities and Exchange Commission. It is provided to you after you have received Form CRS, Regulation Best Interest disclosure and other materials. Past performance does not guarantee future results. The risks associated with investing in fixed income include risks related to interest rate movements as the price of these securities will decrease as interests rates rise (interest rate risk and reinvestment risk), the risk of credit quality deterioration which is an issuer that will not be able to make principal and interest payments on time (credit or default risk), and liquidity risk (the risk of not being able to buy or sell investments quickly for a price that is close to the true underlying value of the asset). Average credit quality is calculated by considering the proportion of the value of each individual credit rating) lower of Moodys or S&P) and noting it as a percentage of the entire portfolio, thus producing the average credit quality. Adverse changes in economic conditions or developments regarding the issuer are more likely to cause price volatility for issuers of high yield debt than would be the case for issuers of higher grade debt securities. A credit rating is an assessment provided by a nationally recognized statistical rating organization (NRSRO) such as Standard & Poor or Moody's of the creditworthiness of the issuer with respect to debt obligations. Ratings are measured on a scale that generally ranges from AAA/AAA (highest, depending on the rating organization) to C or D (lowest, again, depending upon the rating organization). Quality Distribution is based on a weighted average of strategy accounts. Bond ratings are categorized by the lower of Moody's or S&P. For more information regarding bond ratings on municipal bonds, please visit www.moodys.com/ratings or www.spglobal.com/ratings.
* (Taxable Equivalent Yield = YTW adjusted for top Federal tax bracket + 3.8% surcharge for appropriate Munis). The views expressed herein are those of the authors as of the date indicated and may change without notice. They do not necessarily reflect the opinions of Oppenheimer & Co. Inc. or its affiliates and should not be construed as a firm recommendation or investment advice.
Any forward-looking statements are based on current assumptions, expectations, and market conditions, which are subject to change.
There is no guarantee that any projections or views will be realized.
OAM and Oppenheimer & Co. Inc. are both indirect wholly owned subsidiaries of Oppenheimer Holdings Inc. Securities are offered by Oppenheimer & Co. Inc. 8140363.4
