What Happened?
July started and ended with conflicting labor market data, with tariff developments, inflation releases, and an uneventful FOMC meeting sandwiched in between.
The tone was set positively early on by the June Employment Report, released on July 3. A three-month average gain of approximately 150,000 payrolls suggested that the labor market was still holding up despite trade-related uncertainty. Later in the month, inflation data offered more reassurance: both Core CPI and the Fed’s preferred Core PCE came in as expected, easing fears that new tariffs would trigger larger initial jumps in consumer prices.
The White House’s tariff letters outlining a rough overall 15% average tariff rate, were broadly seen as the closing chapter of a drawn-out policy cycle. Markets took this outcome as manageable. Risk assets responded positively, pricing in reduced uncertainty and renewed hopes for the long-term tax and regulatory gains.
In this relatively positive context, the July 30 FOMC meeting brought no surprises on rates, but two dissenting governors — the first since 1993 — pointed to cracks inside the committee. In the Q&A, Chair Powell repeated the need for “more good data” before easing, but also mentioned “downside risks” to the labor market six times.
The next morning, those risks came into focus. The July Employment Report showed a headline gain of +73,000 jobs, which at first appeared neutral, but the real market mover came from the massive downward revisions:
- May: +144,000 → +19,000
- June: +147,000 → +14,000
This pulled the 3-month average down from +150,000 to just +35,000, rattling both equity and fixed income markets and triggering renewed doubts about the true pace of labor market cooling.
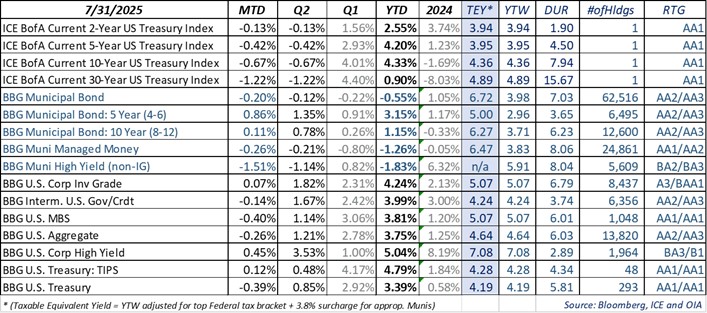
Reference yield changes for the month: (Not reflecting the 8/1 a.m. ~20bp rally)
- 5-year Treasury: 3.80% → 3.97%
- 5-year AAA muni: 2.68% → 2.53% (Taxable Equivalent Yield ~4.27%)
- 10-year Treasury: 4.23% → 4.37%
- 10-year AAA muni: 3.28% → 3.32% (Taxable Equivalent Yield ~5.61%)
Reference Risk/Return snapshot for the month:

All yield figures represent gross market yields and do not reflect the impact of fees or expenses. Index performance is not indicative of the performance of any particular investment. Indexes are unmanaged and their returns do not take into account any of the costs associated with buying and selling individual securities. Individuals cannot invest directly in an index. Past performance is not indicative of future results.
What Are We Thinking?
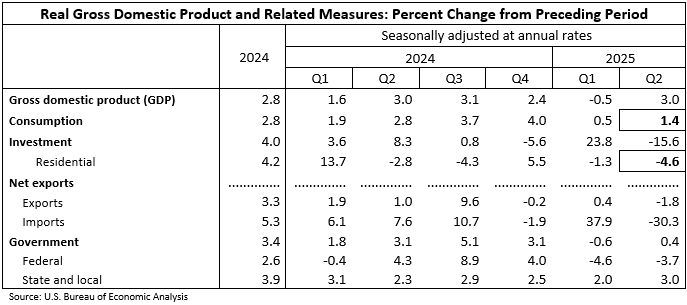
Looking purely at the data, economic momentum appears to have slowed. The U.S. grew at a 1.2% annualized pace in the first half of 2025, down from 2.1% a year ago. Growth is still positive, but below trend personal spending, softer residential investment, and the labor revisions all add to concerns of economic activity being closer to stall speed than it appears.

Inflation trends remain favorable. Core goods are firming slightly — likely due to tariffs — but core services are easing, led by shelter. The Fed continues to signal that inflation is on track toward 2%, even with some one-time, tariff related price increases still working through. Their message remains data-dependent.

The labor story, on the other hand, has become more complicated. While unemployment holds at 4.2%, confidence in job growth has faded. That said, last summer’s labor downshift didn’t lead to a recession — even when monthly payrolls fell below 100k (June to Aug 2024: 87k – 88k – 71k). So far, the unemployment rate held up but markets are watching more closely now. That fragility could weigh more heavily in the Fed’s calculus than previously assumed — making the September meeting a lively one.
Looking ahead to the next FOMC meeting on Sept 17. Four key releases will shape the rate decision:
- Q2 GDP (second estimate) – August 28
- July PCE inflation – August 29
- August Employment Report – September 5
- August CPI – September 11
Depending on the data, the Fed could:
- Hold steady
- Cut by 25
- Or cut by 50, if labor weakness deepens (still less likely without a clear downturn)
Regarding the headlines continuing around the possibility of President Trump firing Fed Chair Powell; our taxable team has repeatedly emphasized the importance of central bank independence in anchoring long-term inflation expectations. The topic may drive investment away from U.S. assets on the margins, and long-term yields could rise substantially if markets perceive a real risk to the Fed’s credibility. Even a dovish, new Fed chair would struggle to lower rates meaningfully in an environment where tariffs push inflation higher.
Bottom line: Should the Fed move earlier than anticipated, especially due to labor weakness or continued disinflation, both taxable and tax exempt fixed income are well positioned to benefit from a shift in rate expectations.

Ozan Volkan
Title:Senior Portfolio Manager OIA Tax-Exempt Fixed Income

Leo Dierckman
Title:Senior Portfolio Manager OIA Taxable Fixed Income

Michael Richman, CFA
Title:Senior Portfolio Manager OIA Taxable Fixed Income
Disclosures
This piece is intended for informational purposes only. All information provided is subject to change. Investing in securities is speculative and entails risk. There can be no assurance that the investment objectives will be achieved or that an investment strategy will be successful Securities are offered through Oppenheimer & Co. Inc., a registered broker-dealer and affiliate of OAM. This material is not a recommendation as defined in Regulation Best Interest adopted by the Securities and Exchange Commission. It is provided to you after you have received Form CRS, Regulation Best Interest disclosure and other materials. Past performance does not guarantee future results. The risks associated with investing in fixed income include risks related to interest rate movements as the price of these securities will decrease as interests rates rise (interest rate risk and reinvestment risk), the risk of credit quality deterioration which is an issuer that will not be able to make principal and interest payments on time (credit or default risk), and liquidity risk (the risk of not being able to buy or sell investments quickly for a price that is close to the true underlying value of the asset). Average credit quality is calculated by considering the proportion of the value of each individual credit rating) lower of Moodys or S&P) and noting it as a percentage of the entire portfolio, thus producing the average credit quality. Adverse changes in economic conditions or developments regarding the issuer are more likely to cause price volatility for issuers of high yield debt than would be the case for issuers of higher grade debt securities. A credit rating is an assessment provided by a nationally recognized statistical rating organization (NRSRO) such as Standard & Poor or Moody's of the creditworthiness of the issuer with respect to debt obligations. Ratings are measured on a scale that generally ranges from AAA/AAA (highest, depending on the rating organization) to C or D (lowest, again, depending upon the rating organization). Quality Distribution is based on a weighted average of strategy accounts. Bond ratings are categorized by the lower of Moody's or S&P. For more information regarding bond ratings on municipal bonds, please visit www.moodys.com/ratings or www.spglobal.com/ratings.
* (Taxable Equivalent Yield = YTW adjusted for top Federal tax bracket + 3.8% surcharge for appropriate Munis). The views expressed herein are those of the authors as of the date indicated and may change without notice. They do not necessarily reflect the opinions of Oppenheimer & Co. Inc. or its affiliates and should not be construed as a firm recommendation or investment advice.
Any forward-looking statements are based on current assumptions, expectations, and market conditions, which are subject to change.
There is no guarantee that any projections or views will be realized.
OAM and Oppenheimer & Co. Inc. are both indirect wholly owned subsidiaries of Oppenheimer Holdings Inc. Securities are offered by Oppenheimer & Co. Inc. 8140363.3

