Asset Management
June Volatility Implications for Fixed Income Investors
July 10, 2025
June was another headline-heavy month, with market sentiment shifting rapidly in response to evolving inflation, geopolitical developments, and fiscal headlines. The month began with a milder-than-expected inflation print, followed by a geopolitical shock in the Middle East that pushed oil prices up by almost $15 per barrel in just 15 days. Investors seesawed between safe-haven positioning and post-tariff optimism, before focus ultimately turned to the approval of the administration’s sprawling tax and spending bill at the Congress. By month-end, markets had broadly calmed, with a notable drop in implied volatility across all asset classes—though for different reasons. Equities were supported by easing geopolitical tensions and steady guidance, while bonds responded to softer inflation momentum and renewed hopes for a potential Fed pivot.
From a macroeconomic standpoint, core inflation continued to moderate on a forward-looking basis, though the Fed made clear it is not yet ready to declare victory. The table below shows annualized monthly core PCE inflation, reinforcing the trend of resumed disinflation:

Despite the improving inflation trajectory, the Fed held its benchmark rate steady at the June 18 FOMC meeting, and raised its year-end Core PCE forecast to 3.1% (from 2.8% in March), explicitly citing tariff-related risks. (In retrospect, Fed Governor Waller did indeed justify the Fed’s cautious stance on June 1st, noting: "Before the recent shift in U.S. trade policy, inflation had been making consistent, but uneven, progress over the past two years toward our 2 percent goal. While that progress seemed to stall at the beginning of 2025, it has resumed over the past two months.")
In the back half of the month, as the Middle East conflict de-escalated, the tone shifted toward “slower but steady” growth. Volatility fell sharply, and bond markets responded to softer inflation and ongoing hope for any signs of labor market cooling that could justify swifter future easing.
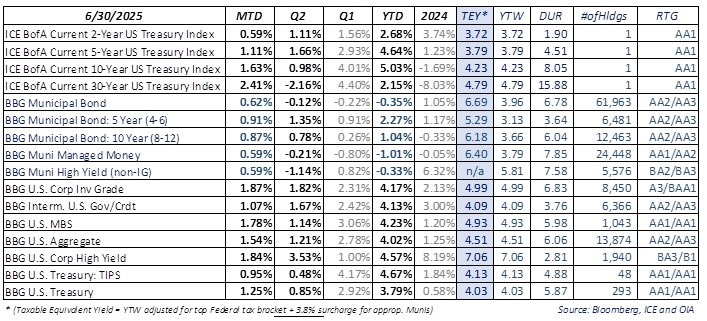
Reference yield changes for the month:
Reference Risk/Return snapshot for the month:
All yield figures represent gross market yields and do not reflect the impact of fees or expenses. Index performance is not indicative of the performance of any particular investment. Indexes are unmanaged and their returns do not take into account any of the costs associated with buying and selling individual securities. Individuals cannot invest directly in an index. Past performance is not indicative of future results.
As the budget resolution bill heads from the Congress to the White House, markets are weighing the potential growth boost from tax cuts against the contractionary drag of tariffs. The interplay between these two forces will be critical for both equity and fixed income investors. On one hand, the bill aims to stimulate growth—while balancing that with phased-in spending cuts to preserve long-term fiscal discipline. On the other hand, tariffs play an important role as a form of offsetting revenue, helping to contain the federal deficit.
That balancing act is now central to the outlook for term premium (the bond market’s compensation for long-term fiscal uncertainty) and the Fed’s future policy path. A sustained shortfall in federal revenues—without credible offsets—could prolong high interest rates and push the government’s interest burden higher. Early projections seem to suggest the new spending bill combined with expected tariff revenue would not increase the federal deficit alarmingly.
While the impact of tariffs, understandably, has not yet shown up in the economic data, recent earnings calls continue to suggest that price increases may be on the way, and consumers and businesses remain understandably cautious from a future economic growth perspective.
So far, corporate bonds have outperformed, supported by solid fundamentals and strong demand for attractive all-in yields. From a municipal bond standpoint, the start of the summer issuance lull creates a constructive technical backdrop. We expect tax-exempt bonds to play catch-up to taxable counterparts over the coming summer months.
Bottom Line: June marked a strong month for nearly all asset classes. We continue to expect a constructive fixed income environment in the second half of the year, especially as investors weigh the durability of fiscal support against rising issuance needs and evolving monetary policy dynamics.

Senior Portfolio Manager OIA Tax-Exempt Fixed Income

Senior Portfolio Manager OIA Taxable Fixed Income

Senior Portfolio Manager OIA Taxable Fixed Income
This piece is intended for informational purposes only. All information provided is subject to change. Investing in securities is speculative and entails risk. There can be no assurance that the investment objectives will be achieved or that an investment strategy will be successful Securities are offered through Oppenheimer & Co. Inc., a registered broker-dealer and affiliate of OAM. This material is not a recommendation as defined in Regulation Best Interest adopted by the Securities and Exchange Commission. It is provided to you after you have received Form CRS, Regulation Best Interest disclosure and other materials. Past performance does not guarantee future results. The risks associated with investing in fixed income include risks related to interest rate movements as the price of these securities will decrease as interests rates rise (interest rate risk and reinvestment risk), the risk of credit quality deterioration which is an issuer that will not be able to make principal and interest payments on time (credit or default risk), and liquidity risk (the risk of not being able to buy or sell investments quickly for a price that is close to the true underlying value of the asset). Average credit quality is calculated by considering the proportion of the value of each individual credit rating) lower of Moodys or S&P) and noting it as a percentage of the entire portfolio, thus producing the average credit quality. Adverse changes in economic conditions or developments regarding the issuer are more likely to cause price volatility for issuers of high yield debt than would be the case for issuers of higher grade debt securities. A credit rating is an assessment provided by a nationally recognized statistical rating organization (NRSRO) such as Standard & Poor or Moody's of the creditworthiness of the issuer with respect to debt obligations. Ratings are measured on a scale that generally ranges from AAA/AAA (highest, depending on the rating organization) to C or D (lowest, again, depending upon the rating organization). Quality Distribution is based on a weighted average of strategy accounts. Bond ratings are categorized by the lower of Moody's or S&P. For more information regarding bond ratings on municipal bonds, please visit www.moodys.com/ratings or www.spglobal.com/ratings.
* (Taxable Equivalent Yield = YTW adjusted for top Federal tax bracket + 3.8% surcharge for appropriate Munis). The views expressed herein are those of the authors as of the date indicated and may change without notice. They do not necessarily reflect the opinions of Oppenheimer & Co. Inc. or its affiliates and should not be construed as a firm recommendation or investment advice.
Any forward-looking statements are based on current assumptions, expectations, and market conditions, which are subject to change.
There is no guarantee that any projections or views will be realized.
OAM and Oppenheimer & Co. Inc. are both indirect wholly owned subsidiaries of Oppenheimer Holdings Inc. Securities are offered by Oppenheimer & Co. Inc. 8140363.2
