Asset Management
November Volatility Implications for Fixed Income Investors
December 03, 2025
The longest U.S. government shutdown finally ended in November after 43 days. Even after its end, the effects carried through the month. Several key releases were delayed, and the data that did come out often reflected timing issues. The next jobs report will arrive on December 16 and the CPI report on December 18—both after the December 9–10 Fed meeting. With that backdrop, the broad message stayed familiar: steady demand, softer hiring, and a more cautious tone going into year-end.
More importantly, this was the last employment release before the December Fed meeting, and it did not offer a clearer view of the underlying trend.
Reference Yields for the Month:
Reference Risk/Return Snapshot for the Month:
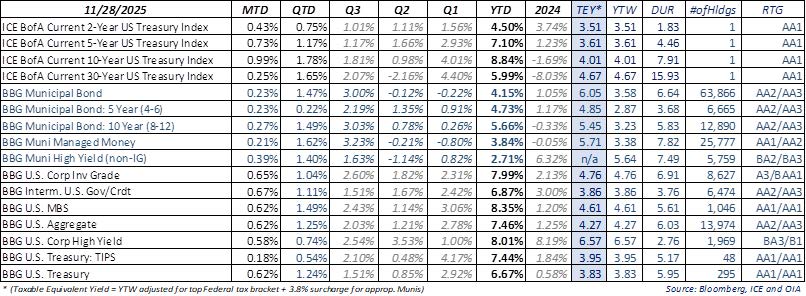
All yield figures represent gross market yields and do not reflect the impact of fees or expenses. Index performance is not indicative of the performance of any particular investment. Indexes are unmanaged and their returns do not take into account any of the costs associated with buying and selling individual securities. Individuals cannot invest directly in an index. Past performance is not indicative of future results.
The overall picture remains one of a slow-cooling economy. Services continue to lead, manufacturing is still soft, and weekly claims point to a labor market that is easing but stable. With most of the major data prints pushed into mid-December, the Fed is heading into its next meeting with limited fresh information and a preference to move carefully.
Against this backdrop, we believe the bar for a December rate cut is lower than it seemed after the October meeting. Softer hiring, steady demand, and inflation readings not veering wildly above the Fed’s preferred range give the “Risk Management” minded Committee room to adjust policy, especially with so little confirmed data in hand. It is also telling that New York Fed President John Williams said policy remains “modestly restrictive” and that there is room for a “further adjustment in the near term” to move rates closer to neutral. In our opinion, Williams is part of the Fed’s leadership troika with Chair Powell and Vice Chair Jefferson, and this group rarely signals policy intent without a shared view. We believe that makes his language extra meaningful and telegraphs that the Committee is leaning toward a cut at the December meeting.
As we have throughout 2025, we remain positive on credit given corporate fundamentals, coupled with persistent institutional demand and limited net new supply anchoring credit spreads and performance. Per the Bloomberg U.S. Credit Index, investment grade corporate credit spreads were slightly wider versus comparable U.S. Treasury yields in the month. Corporate spreads are tight but we expect fundamentals and technical factors to remain supportive through year-end. Corporate bond demand remains strong on the back of attractive all-in yields. We continue to believe credit selection will be paramount if the focus shifts toward the ability of corporates to navigate macro uncertainty.
For municipals, year-end technicals continue to support the asset class. Issuance is light, reinvestment flows are steady, and the Treasury range has been stable. Intermediate AAA yields continue to look attractive on a taxable-equivalent basis, and we view any meaningful backup in yields as an opportunity to add high-quality exposure into December.
Bottom Line: Near-term attention remains on labor softening and a likely December cut, but the medium-term picture carries more uncertainty. The return of full expensing for capital investment on January 1, 2026, combined with the expected rebound from shutdown-delayed activity, could firm the growth baseline next year. It is too early to know how strong these effects will be, but they create a two-sided risk for long-duration rates. The base case remains orderly, yet a tail risk exists in which stronger activity and higher investment incentives may put some upward pressure on the long end as 2026 unfolds.

Senior Portfolio Manager OIA Tax-Exempt Fixed Income

Senior Portfolio Manager OIA Taxable Fixed Income

Senior Portfolio Manager OIA Taxable Fixed Income
This piece is intended for informational purposes only. All information provided is subject to change. Investing in securities is speculative and entails risk. There can be no assurance that the investment objectives will be achieved or that an investment strategy will be successful Securities are offered through Oppenheimer & Co. Inc., a registered broker-dealer and affiliate of OAM. This material is not a recommendation as defined in Regulation Best Interest adopted by the Securities and Exchange Commission. It is provided to you after you have received Form CRS, Regulation Best Interest disclosure and other materials. Past performance does not guarantee future results. The risks associated with investing in fixed income include risks related to interest rate movements as the price of these securities will decrease as interests rates rise (interest rate risk and reinvestment risk), the risk of credit quality deterioration which is an issuer that will not be able to make principal and interest payments on time (credit or default risk), and liquidity risk (the risk of not being able to buy or sell investments quickly for a price that is close to the true underlying value of the asset). Average credit quality is calculated by considering the proportion of the value of each individual credit rating) lower of Moodys or S&P) and noting it as a percentage of the entire portfolio, thus producing the average credit quality. Adverse changes in economic conditions or developments regarding the issuer are more likely to cause price volatility for issuers of high yield debt than would be the case for issuers of higher grade debt securities. A credit rating is an assessment provided by a nationally recognized statistical rating organization (NRSRO) such as Standard & Poor or Moody's of the creditworthiness of the issuer with respect to debt obligations. Ratings are measured on a scale that generally ranges from AAA/AAA (highest, depending on the rating organization) to C or D (lowest, again, depending upon the rating organization). Quality Distribution is based on a weighted average of strategy accounts. Bond ratings are categorized by the lower of Moody's or S&P. For more information regarding bond ratings on municipal bonds, please visit www.moodys.com/ratings or www.spglobal.com/ratings.
* (Taxable Equivalent Yield = YTW adjusted for top Federal tax bracket + 3.8% surcharge for appropriate Munis). The views expressed herein are those of the authors as of the date indicated and may change without notice. They do not necessarily reflect the opinions of Oppenheimer & Co. Inc. or its affiliates and should not be construed as a firm recommendation or investment advice.
Any forward-looking statements are based on current assumptions, expectations, and market conditions, which are subject to change.
There is no guarantee that any projections or views will be realized.
OAM and Oppenheimer & Co. Inc. are both indirect wholly owned subsidiaries of Oppenheimer Holdings Inc. Securities are offered by Oppenheimer & Co. Inc. 8140363.7
