Asset Management
What Can Derail the AI Train?
January 22, 2026
Markets are entering 2026 with confidence supported by Fed rate cuts, fiscal stimulus, and continued enthusiasm around artificial intelligence. Even so, we expect a choppier market environment ahead as softening labor trends, elevated valuations, and mounting risks tied to the AI trade begin to challenge investor optimism.
Economic growth has been resilient, but inflation is still running above the Fed’s target and policymakers are working to support employment without reigniting price pressures. While upcoming tax relief could offer some help, we believe much of its potential benefit may already be reflected in asset prices.
At the same time, AI’s rapid expansion brings significant hurdles—including heavy capital requirements, power constraints, and potential impacts on the labor market. In this environment, we see compelling opportunity in healthcare and biotech, where companies are leveraging AI, valuations are more attractive, and long term growth drivers remain intact.
Equity sentiment remains positive heading into 2026, as many investors expect tailwinds from fiscal and monetary policy and the artificial intelligence (“AI”) revolution to propel U.S. stocks to a fourth consecutive year of gains. While the macro landscape appears favorable, emerging weakness in the labor market, stretched valuations, and risks to the AI trade may disrupt the positive narrative. OAM Research expects a more volatile environment in 2026, but we continue to find opportunities in underappreciated areas of the market such as healthcare.
We expect the strength of the labor market will serve as the primary determinant of monetary policy decisions and consumption trends throughout 2026. Labor demand cooled in 2025 as job growth was concentrated in just a few sectors. Nonfarm payroll growth averaged just 49,000 per month in 2025, a sharp decline from the 168,000 monthly gains in 2024.1 Job losses occurred in three of the last seven months, and the upcoming annual benchmark revision in March may reveal even weaker growth than initially reported. The unemployment rate steadily increased for most of the last year, though at 4.4% it remains low compared to history.
While hiring has been muted, companies thus far have been reluctant to cut jobs altogether. Initial jobless claims remain relatively low and elevated layoff announcements communicated in the Challenger Job Cuts report have failed to show up in official statistics. However, continuing jobless claims remain elevated and individuals out of work are finding it increasingly more difficult to find new employment.
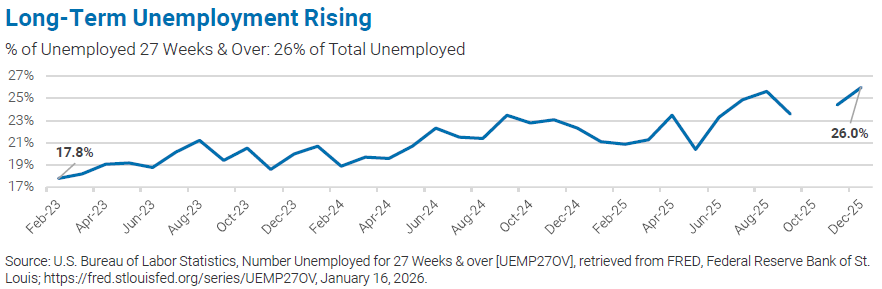
With immigration policies contributing to a reduced labor supply, the threshold for employment growth equilibrium has lowered; nevertheless, the emergence of stagnant growth and periodic job losses suggests weakening demand side dynamics. Some of the weakness is attributed to shifting labor dynamics and efficiency gains from AI adoption, rather than acute financial stress alone. However, with the labor market entering 2026 in a “low hire, low fire” limbo, any further rise in unemployment or a sustained lack of job creation could have significant implications for consumer spending and overall economic growth throughout the coming year.
Inflation persists above the Federal Reserve’s (“Fed”) 2% objective, though tariffs have not yet induced price acceleration. The December Core Consumer Price Index (“Core CPI”) came in at 2.6% growth year-over-year, decelerating from north of 3% over the summer and into September. However, data collection due to the shutdown distorted the October and November readings. Despite ongoing concerns from consumers about higher prices, market-based longer-term inflation expectations remain anchored around 2.25% to 2.50%.2
The Fed may accept inflation modestly exceeding its target absent indications of acceleration, particularly if labor market conditions deteriorate further, but the cumulative impact of prolonged inflation is increasingly weighing on purchasing decisions. Wage growth for lower-end consumers has slowed and is barely keeping pace with inflation, leading to an increased reliance on credit and trade-down behaviors. Fast food and fast casual restaurants catering to this cohort have encountered challenges due to price sensitivity, while discount big box retailers have benefited from the trade-down effect.
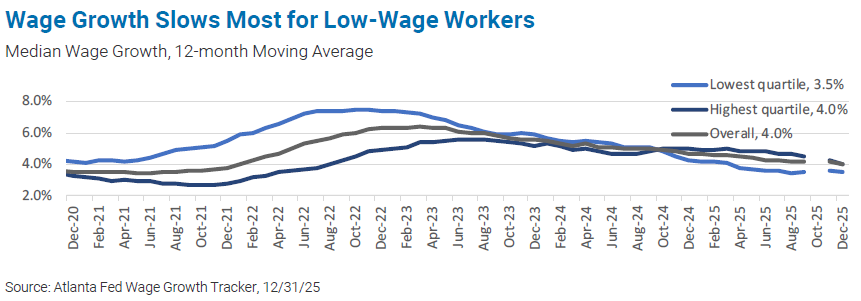
However, aggregate spending has exhibited resilience thanks to robust activity from higher income consumers. High-end consumers have benefited from stock and home price appreciation and have supported spending in discretionary sectors. The wealth effect could continue to drive this K-shaped divergence in 2026, though a pullback in equities could slow spending, negatively impacting growth.
The Fed is navigating a challenging environment in which the goals of its dual mandate, maximum employment and price stability, are pulling policy in opposite directions. At this juncture, the Fed appears to be placing greater emphasis on protecting the labor market as the committee delivered rate cuts totaling 0.75% in 2025.
The outlook for further rate reductions is cloudy. The Fed’s Summary of Economic Projections released in December showed wide dispersion amongst year-end rate projections for 2026, with the median estimate calling for just one rate cut in the year. Ultimately, a further softening of the labor market may force the Fed’s hand to cut interest rates more aggressively.
Fiscal stimulus through tax reductions is scheduled to materialize in consumers’ accounts in April 2026, potentially bolstering spending. The One Big Beautiful Bill Act (OBBB) introduces several key tax breaks that extend and enhance provisions from the 2017 Tax Cuts and Jobs Act, aiming to provide relief to individuals and businesses. Existing deductions increased, new deductions for qualified vehicle purchases were introduced, the SALT deduction cap was raised, and estate, gifts, and generation-skipping transfer tax exemptions rose. These consumer-oriented tax breaks will increase after-tax income, thereby stimulating discretionary spending and potentially enhancing economic confidence amid labor market uncertainties.
Businesses also stand to benefit from changes to the tax code in 2026. The OBBB extended the 2017 tax cuts, increased small business tax deductions, allowed 100% bonus depreciation on qualified property, and extended full deductions for research and development. These changes should lower effective tax rates and encourage reinvestment in operations, hiring, or expansion. This may translate to improved cash flows, supporting balance sheet health and potentially mitigating pressures from elevated interest rates and trade disruptions.
Excitement around AI was the driving force behind the U.S. market appreciation in 2025, but valuations for many AI-related stocks have gotten extended. The market may not be fully appreciating the risks associated with the infrastructure build-out and the integration of AI into the broader economy.
Hyperscaler capex spending increased dramatically and is expected to accelerate further in the coming years, as these companies view falling behind in the AI race as an existential threat. The extensive build-out of the infrastructure for AI provided significant growth tailwinds, but concerns surrounding the returns on these investments continue to build. While the capex has mostly been funded by operating cash flows, these projects are now taking up a higher percentage of cash flows, and some hyperscalers have turned to the debt markets for financing. If the returns on investment fail to meet lofty expectations, or if AI-related revenues take longer to come to fruition, then these projects could lead to significant losses or credit problems that would reverberate through equity markets.
Hopes for significant future profits have enticed many new entrants into the AI race. In 2025 most of these companies benefited just from the affiliation, but longer term, the increased competition will create both AI winners and losers. Nvidia is the clear leader in designing chips for AI, but growth expectations are sky high even as other companies are working to catch up. Valuations are also lofty for companies with large language models, but switching costs are low and revenue growth could stall quickly if leadership shifts. Many energy and infrastructure companies have benefited from their perceived roles in the space, but not all of them will live up to the hype.
The AI-powered economy of the future may also drastically alter the labor force. While data center construction will lead to short-term job creation, over the long term more jobs may be at risk if AI tools become more widely adopted across the economy. Companies prioritizing efficiency gains and maximizing profit margins will adopt new AI applications in place of costlier labor, eventually leading to sizable increases in the number of unemployed individuals. This dynamic could worsen the wealth divide in the U.S., as there will be clear winners and losers from the AI revolution. A larger unemployed population will likely require more government support and could contribute to social unrest.
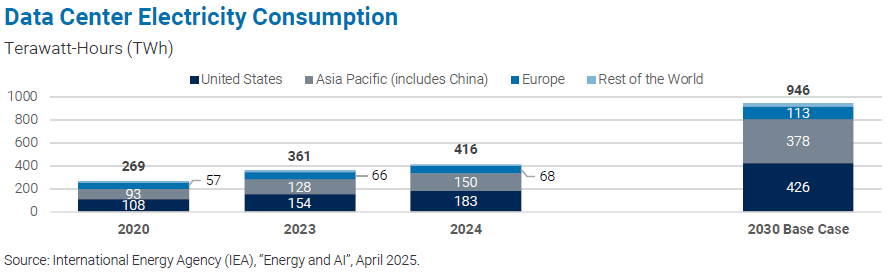
The compute necessary to build and train complex AI models requires a broad array of large-scale data centers, and these AI-focused companies are rapidly expanding their data center footprint in response. The sheer power demand of these facilities, with some individual centers requiring city-scale electricity, is driving a structural shift in the energy sector. This surging demand, projected to more than double globally by 2030, is straining electric grids. To meet this unprecedented need, utility companies are exploring options that include new natural gas plants, additional renewable and nuclear capacity, and in some cases, delaying the retirement of older, less-clean facilities. However, bringing new power onto the grid will take time and near-term power constraints will persist.
The data center buildout has implications for local communities as well. The power constraint has led to higher residential utility bills, an issue that is unlikely to be resolved in the near term. The added strain on the power grid also makes these areas more prone to blackouts. There is also a negative environmental footprint from the power plants and diesel generators needed to power the data centers. Outside of just energy, data centers drain other resources from the communities that house them. AI-focused data centers generate significantly more heat and require more complex cooling strategies.
A single hyperscale data center can consume as much water as a small city for cooling, putting a strain on local water supplies. There are also concerns over land use, especially farmland, as more and more data centers are needed. While these projects can generate meaningful tax revenue for local governments, if citizens do not experience a personal benefit, they will ultimately seek to block these buildouts from occurring in their area.
The investment implications of these dynamics will be nuanced. The power constraint can temper the valuations of core AI companies, though this bottleneck creates attractive investment opportunities in companies that solve the power and cooling problem. Local issues surrounding data center builds may slow down the infrastructure build-out, tempering gains. Finally, concerns around AI’s impact on the job market will have far-reaching impacts, including a potential reduction in demand for consumer-oriented companies.
While AI has the potential to create lasting impacts along the lines of prior innovations like the internet, the technology is still nascent and all of the effects it will have on society are still being learned. AI-related gains may still lie ahead for the stock market, but investors should be prudent in tempering optimism by acknowledging some of the risks associated with the build-out.
OAM Research believes healthcare and biotech companies in both public and private markets are poised for a strong 2026. Several secular drivers such as aging populations, technological innovation, and looming patent cliffs should provide meaningful tailwinds over the intermediate term. Relative valuations remain attractive, with the sector trading at a 17% discount to the S&P 500’s forward price-to-earnings multiple, creating significant upside potential as fundamentals stabilize. Policy overhangs are also easing, including drug pricing reforms like ‘Most Favored Nation’ policies moving to the background, the avoidance of steep tariffs through U.S. manufacturing commitments, and supportive FDA initiatives that accelerate approvals for rare diseases and innovative therapies.
This regulatory clarity reduces uncertainty that weighed on the sector in the first half of 2025. Innovation is surging, and AI adoption is leading to lower costs and greater success rates in drug development. Biotech companies today have robust drug pipelines and there has been a record pace of FDA approvals in areas like oncology, schizophrenia, and metabolic disorders. Merger and acquisition activity has also ramped up, surpassing 2024 levels, providing liquidity and growth opportunities for small and mid-cap firms.3 Finally, declining interest rates are expected to unlock capital for high-growth biotech companies, while renewed investor inflows and desire for diversification bolster sentiment. Overall, we believe these dynamics create attractive opportunities in the sector.
Asset class views reflect a medium-term outlook by OAM Research based on macroeconomic trends, valuations, and technical indications and are intended to advise allocation tilts relative to an appropriate strategic asset allocation.


Large cap fundamentals remain healthy and earnings growth has been strong. Growth stocks continue to be fueled by optimism around AI, but valuations and expectations of future growth are high. Higher-quality companies with pricing power should be more resilient, and investors may benefit from allocating to strategies focused on quality and downside protection. Value stocks remain attractive given relative undervaluation, more defensive business models, and more reasonable growth expectations.

Small and mid-cap valuations appear more attractive relative to large caps and could continue to benefit from the market broadening if growth remains resilient. Unprofitable, high-beta small cap stocks led the latest rally, but higher quality small and mid-cap companies look compelling today and should be more resilient if the economy turns.

Positive economic surprises, fiscal and monetary tailwinds, U.S. dollar weakness, and mean reversion may continue to drive outperformance. Relative valuations remain attractive and fiscal spending in Europe could provide meaningful stimulus, but expectations are tempered by higher tariffs and their impact on global growth. Risk reward in international equities appears better than in the U.S. given more supportive policies, lower valuations, and greater dividend returns, which can provide a ballast to portfolios.

Valuations remain reasonable and look attractive relative to developed equities. Global EM growth is expected to remain strong, but heightened trade concerns and significant currency fluctuations can have meaningful implications for many emerging countries. Active managers can take advantage of bifurcated performance by allocating to countries with more promising growth prospects.
Long/Short Equity is considered part of the strategic asset allocation for equities based on each fund’s underlying investments.

Long/short strategies can benefit from higher volatility and dispersion to add long and short alpha. Many managers benefited from crowded momentum trades in 2025, but we anticipate more diversified sources of alpha in 2026. Managers that can effectively manage exposure can provide downside protection if momentum fades. Non-U.S. investments are expected to increase within portfolios given attractive fundamentals.

Treasury yields remain rangebound as the market weighs the impacts of sticky inflation and labor market weakness on the Fed’s decisions. Current yields are attractive, and the asset class should continue to provide portfolio protection if growth deteriorates. Investment-grade credit spreads are still tight, but corporate balance sheets remain healthy. Yields on high-quality securitized products appear compelling.

High yield credits continue to trade at historically tight spreads. Defaults remain muted and leverage is not excessive. Absolute yields are still attractive, but the asset class may be subject to a material drawdown if growth stalls or an unforeseen credit event arises. Private asset-backed lending strategies appear more compelling than corporate direct lending.

International bonds provide above-average yield and have benefited from dollar weakness. Emerging market debt looks more attractive within the non-U.S. market, both from a yield perspective and as a portfolio diversifier, though the asset class may suffer if global growth slows meaningfully or dollar strength resurfaces.

Inflation concerns persist, highlighting the important role of real assets in portfolios. Midstream energy infrastructure has been resilient despite oil price declines given strong fundamentals and elevated yields. Utilities and Infrastructure can continue to benefit from thematic tailwinds as well as their defensive characteristics. REITs could benefit from stable or falling interest rates as long as growth doesn’t decelerate meaningfully.

Event-driven strategies are benefiting from a rebound in M&A volumes in recent months. Deal activity may continue to recover as policy clarity emerges, rates decline, and growth remains resilient, though deal spreads have tightened and may limit the upside potential.
Opinions expressed are current as of 01/20/2026 and are subject to change. These opinions do not guarantee future results.
1. Source: Bureau of Labor Statistics (BLS).
2. Source: Federal Reserve Bank of St. Louis, 5-Year Breakeven Inflation Rate [T5YIE], retrieved from FRED, Federal Reserve Bank of St. Louis; https://fred.stlouisfed.org/series/T5YIE, January 20, 2026.
3. Source: The Merger Fund Q42025 Quarterly Commentary.
The opinions expressed herein are subject to change without notice. The information and statistical data contained herein has been obtained from sources we believe to be reliable. Past performance is not a guarantee of future results.
The above discussion is for illustrative purposes only and mention of any security should not be construed as a recommendation to buy or sell and may not represent all investment managers or mutual funds bought, sold, or recommended for client’s accounts. There is no guarantee that the above-mentioned investments will be held for a client’s account, nor should it be assumed that they were or will be profitable.<
OAM is an indirect, wholly owned subsidiary of Oppenheimer Holdings Inc., which also indirectly wholly owns Oppenheimer & Co. Inc. (Oppenheimer), a registered broker dealer and investment adviser. Securities are offered through Oppenheimer.
For information about the advisory programs available through OAM and Oppenheimer, please contact your Oppenheimer financial advisor for a copy of each firm’s ADV Part 2A.
Adopting a fee-based account program may not be suitable for all investors; anticipated annual commission costs should be compared to anticipated annual fees.
S&P Equal Weighted is the equal-weight version of the S&P 500. The index is comprised of the same stocks of the S&P 500, but each company is allocated a fixed percentage (.2%) of the total index.
MSCI AC World ex-USA Index captures large- and mid- cap representation across 22 of 23 developed-market countries (excluding the U.S.) and 24 emerging-market countries.
MSCI EAFE is an index in U.S. dollars based on the share price of companies listed on stock exchanges in 21 developed countries outside of North America. This Index is created by aggregating the 21 different country Indices, all of which are created separately. It is considered to be generally representative of overseas stock markets.
Russell 2000 Index measures the performance of the 2,000 smallest companies in the Russell 3000 index. Frank Russell Co. ranks the U.S. common stocks from largest to smallest market capitalization at each annual reconstitution period. The Russell 2000 Index represents a very small percentage of the total market capitalization of the Russell 3000 Index. It is considered to be generally representative of U.S. Equity Small and Mid Cap performance
Russell 1000 Value Index measures the performance of the Russell 1000 companies with lower price-to-book ratios and lower forecasted growth values.
MSCI Emerging Markets Index is a market capitalization weighted Index in U.S. dollars representing 26 emerging markets in the world. The Index is created by aggregating the 26 different country Indices, all of which are created separately. It is considered to be generally representative of overseas stock markets.
Russell 1000 Growth Index measures the performance of the Russell 1000 companies with higher price-to-book ratios and higher forecasted growth values.
S&P 500 Sector/Information Technology TR Index consists of stocks chosen for their representation in the Info Tech industry. Companies considered are involved in technology software and technology hardware and equipment. It is a market value weighted Index (stock price times number of shares outstanding), with each stock’s weight in the Index proportionate to its market value.
LTM PE Ratio is the last 12-month price-to-earnings ratio.
Indices are unmanaged, do not reflect the costs associated with buying and selling securities and are not available for direct investment.
Risk Factors
The success of an investment program may be affected by general economic and market conditions, such as interest rates, the availability of credit, inflation rates, economic uncertainty, changes in laws and national and international political circumstances. These factors may affect the level and volatility of securities prices and the liquidity of a portfolio’s investments. Unexpected volatility or illiquidity could result in losses. Investing in securities is speculative and entails risk. There can be no assurance that the investment objectives will be achieved or that an investment strategy will be successful.
Special Risks of Foreign Securities
Investments in foreign securities are affected by risk factors generally not thought to be present in the United States. The factors include, but are not limited to, the following: less public information about issuers of foreign securities and less governmental regulation and supervision over the issuance and trading of securities. International investments may involve risk of capital loss from unfavorable fluctuation in currency values, from differences in generally accepted accounting principles or from economic or political instability in other nations.
Special Risks of Small- and Mid-Capitalization Companies
Investments in companies with smaller market capitalization are generally riskier than investments in larger, well established companies. Smaller companies often are more recently formed than larger companies and may have limited product lines, distribution channels and financial and managerial resources. These companies may not be well known to the investing public, may not have significant institutional ownership and may have cyclical, static or moderate growth prospects. There is often less publicly available information about these companies than there is for larger, more established issuers, making it more difficult for the Investment Manager to analyze that value of the company. The equity securities of small- and mid-capitalization companies are often traded over-the-counter or on regional exchanges and may not be traded in the volume typical for securities that are traded on a national securities exchange. Consequently, the investment manager may be required to sell these securities over a longer period of time (and potentially at less favorable prices) than would be the case for securities of larger companies. In addition, the prices of the securities of small- and mid-capitalization companies may be more volatile than those of larger companies.
Special Risks of Fixed Income Securities
For fixed income securities, there is a risk that the price of these securities will go down as interest rates rise. Another risk of fixed income securities is credit risk, which is the risk that an issuer of a bond will not be able to make principal and interest payments on time. Liquidity risk is the risk that you might not be able to buy or sell investments quickly for a price that is close to the true underlying value of the asset. When a bond is said to be liquid, there’s generally an active market of investors buying and selling that type of bond. Fixed income securities markets are subject to many factors, including economic conditions, government regulations, market sentiment, and local and international political events. Further, the market value of fixed-income securities will fluctuate depending on changes in interest rates, currency values and the creditworthiness of the issuer.
High Yield Fixed Income Risk
High yield fixed income securities are considered to be speculative and involve a substantial risk of default. Adverse changes in economic conditions or developments regarding the issuer are more likely to cause price volatility for issuers of high yield debt than would be the case for issuers of higher-grade debt securities. In addition, the market for high yield debt may be less attractive than that of higher-grade debt securities.
Special Risks of Event-Driven Strategies
Investing in event or disruption driven strategies carries the risk of the unforeseen nature of events, such as corporate transactions falling through or changes in the economic or political environment. A reduction in money market liquidity or pricing inefficiency, as well as other market factors, can potentially reduce the scope for these investment strategies. Such funds may be adversely affected by unforeseen events, including forced redemptions of securities or acquisition proposals, break-up of planned mergers, unexpected changes in relative value, short squeezes, inability to short stock or changes in tax treatment.
Special Risks of Long/Short Equity
Long/short equity strategies utilize leverage, and may do so through direct borrowing, short selling, options and other instruments (including, without limitation, derivatives) and arrangements with embedded leverage. While strategies, techniques and instruments that employ leverage increase the opportunity to achieve higher returns on the amounts invested, they also increase the risk of loss. Hedging and selling securities short entails losing an amount greater than proceeds received or possible default by the other party to the transaction.
Special Risks of Uncorrelated Strategies
Strategies such as multi-strategy, macro and CTA utilize leverage, and may do so through direct borrowing, short selling, options and other instruments (including, without limitation, derivatives) and arrangements with embedded leverage. Hedge funds, commodity pools and other alternative investments involve a high degree of risk and can be illiquid due to restrictions on transfer and lack of a secondary trading market. In addition, they may be subject to commodity risk, derivatives risk, foreign investment risk, foreign currency risk, and credit risk. Many hedge funds employ a single investment strategy. Thus, a hedge fund or even multi-strategy hedge funds may be subject to strategy risk, associated with the failure or deterioration of an entire sub-strategy. Strategy specific losses can result from excessive concentration by multiple hedge fund managers in the same investment or broad events that adversely affect particular strategies.
Special Risks of Alternative Investments
Alternative investments are not appropriate for all investors and only may be offered to certain qualified investors. Investors must be able to bear the economic risk of such an investment for an indefinite period and can afford to suffer the complete loss of investment. An Investor’s ability to redeem from such investments is limited to specific time periods (e.g. monthly, quarterly, semi-annually, annually) with certain notice requirements. Investing in securities is speculative and involves substantial risk. There can be no assurance that any investment strategy will be successful. This information is provided for informational purposes only and should not be construed as an endorsement of or a solicitation to invest in any specific program. There is a substantial risk of loss when investing in alternative investments and, for each specific fund, the risk of underperforming the general markets or other funds.
Special Risks of Real Assets
Master limited partnerships are publicly listed securities that trade much like a stock, but they are taxed as partnerships. MLPs are typically concentrated investments in assets such as oil, timber, gold and real estate. The risks of MLPs include concentration risk, illiquidity, and exposure to potential volatility, tax reporting complexity, fiscal policy and market risk. MLPs are not suitable for all investors. Common risks associated with an investment in a REIT include, but are not limited to, real estate portfolio risk (including development, environmental, competition, occupancy and maintenance risk), general economic risk, market and liquidity risk, interest rate risk, sector diversification and geographic concentration risk, leverage risk, distribution risk, capital markets risk, growth risk, counterparty risk, conflicts of interest risk, key personnel risk, and structural and regulatory risk.
Forward Looking Statements
This presentation may contain forward looking statements or projections. These statements and projections relate to future events or future performance. Forward-looking statements and projections are based on the opinions and estimates of Oppenheimer as of the date of this presentation, and are subject to a variety of risks and uncertainties and other factors, such as economic, political, and public health, that could cause actual events or results to differ materially from those anticipated in the forward-looking statements and projections.
Oppenheimer & Co. Inc. (Oppenheimer), a registered broker/dealer and investment adviser, is a indirect wholly owned subsidiary of Oppenheimer Holdings Inc. Securities are offered through Oppenheimer. If you select one or more of the advisory services offered by Oppenheimer & Co. Inc. (Oppenheimer) or its affiliate Oppenheimer Asset Management Inc. (OAM), the respective entity will be acting in an advisory capacity. Financial planning services are provided by Oppenheimer If you ask us to effect securities transactions for you, Oppenheimer will be acting as a broker-dealer. Please see the Oppenheimer & Co. Inc. website, www.opco.com or call the branch manager of the office that services your account, for further information regarding the difference between brokerage and advisory products and services. Trust services are provided by Oppenheimer Trust Company of Delaware, an affiliate of Oppenheimer. Diversified strategy investments such as natural resources, commodities or futures, real estate investment trusts (REITs), are made available by Oppenheimer only to qualified investors and involve varying degrees of risk. All information provided and opinions expressed are subject to change without notice. Neither Oppenheimer, Oppenheimer Trust Company of Delaware nor OAM provide legal or tax advice. However, your Oppenheimer Financial Professional will work with clients, their attorneys and their tax professionals to help ensure all of their needs are met and properly executed. Investing in securities involves risk and may result in loss of principal. There is no assurance any recommended strategy will be successful. Past performance does not guarantee future results.
© 2026 Oppenheimer & Co. Inc. Transacts Business on All Principal Exchanges and Member SIPC. All rights reserved. No part of this brochure may be reproduced in any manner without the written permission of Oppenheimer. 8726295.1
