Asset Management
Market Observations: August 2025 Recap
September 16, 2025
The S&P 500, MSCI EAFE, and MSCI Emerging Markets indices returned 2.0%, 4.3%, and 1.3%, respectively. The U.S. 10-year Treasury yield ended the month at 4.23% after falling by 0.14% during the month. The closely followed 2-year/10-year spread finished the month at 0.64%, 0.21% wider than a month earlier. Investment grade and high yield corporate bonds appreciated. The U.S. dollar fell by 2.2%, reversing much of last month’s rally.
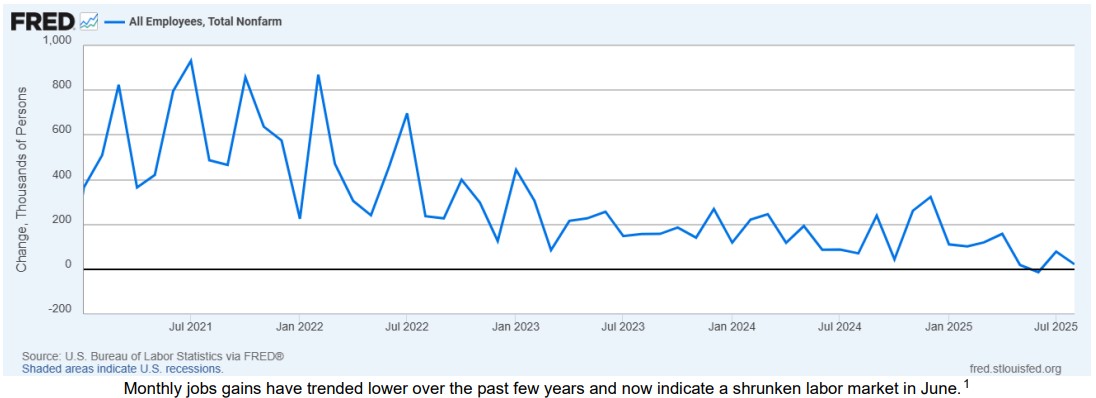
The current market consensus is that the Federal Reserve will lower the fed funds rate on September 17. The majority of committee members has communicated the belief that the risk of a softening labor market is a greater concern than the possibility of stoking inflation. While the unemployment rate remains low at 4.3%, recent nonfarm payroll reports and revisions have caught the attention of policy makers and investors. In the first payroll report since the head of the Bureau of Labor Statistics was fired, it was announced that only 22,000 jobs were added in August compared to the expected 75,000. Additionally, the June data was revised lower again and now reflects a reduction of 13,000 jobs, the first negative month since December 2020. The July jobs report was revised slightly higher. The Quarterly Census of Employment and Wages (QCEW) released on September 9 estimated that 911,000 fewer jobs were created during the year prior to March 2025 than previously announced, providing additional evidence of a softening labor market. The revision was on the high end of the expected range and represents the largest percentage negative revision since the global financial crisis. The revision is subject to an update in March 2026. Last year’s similarly large negative initial QCEW revision of 818,000 was subsequently adjusted to a still-sizable 598,000.
The following is a summary of key points that occurred in the markets globally during the month.
US Equity Summary:
Developed and Emerging Market Equity Summary:
Fixed Income Summary:
Indices are unmanaged and presented for comparison purposes only. Please note that the returns displayed for indices do not take into account any of the costs associated with buying and selling individual securities. Individuals cannot invest directly in an index.
Bloomberg Global Aggregate Bond Index: provides a broad-based measure of the global investment-grade fixed rate debt markets. It contains three major components that comprise over 94% of the value: the U.S. Aggregate Index, the Pan-European Aggregate Index and the Asian-Pacific Aggregate Index. In addition to securities from these three benchmarks, the index also includes Global Treasury, Eurodollar, Euro-Yen, Canadian and Investment-Grade 144A index-eligible securities not already in the three regional aggregate indices.
Bloomberg Municipal TR USD: The Bloomberg Barclays Municipal Bond Index is considered representative of the broad market for investment grade, tax-exempt bonds with a maturity of at least one year.
Bloomberg US Corporate High Yield TR USD: Bloomberg Barclays US Corporate High Yield TR USD
Bloomberg US Credit TR USD: The index measures the performance of investment grade corporate bonds.
Bloomberg US Treasury 1-3 Yr TR USD: The Bloomberg Barclays Capital US Treasury Bond 1-3yr term index measures the performance of short-term government bonds issued by the US Treasury.
Bloomberg US Treasury 10 Yr USD: The index measures the performance of government bonds issued by the US Treasury.
Bloomberg US Treasury 20+ Yr TR USD: The Index is market capitalization weighted and includes all of the securities that meet the Index criteria. The index includes all publicly issued, U.S. Treasury securities that have a remaining maturity greater than 20 years, are non-convertible, are denominated in U.S. dollars, are rated investment grade (Baa3 or better) by Moody’s Investors Service, are fixed rate, and have more than $150 million par outstanding. Excluded from the Index are certain special issues, such as flower bonds, targeted investor notes (TINs) and state and local government series bonds (SLGs), and coupon issues that have been stripped from assets already included.
Bloomberg US Aggregate Bond Index: The U.S. Aggregate Index covers the USD-denominated, investment-grade, fixed-rate, taxable bond market of SEC-registered securities. The Index includes bonds from the Treasury, Government-Related, Corporate, MBS (agency fixed-rate and hybrid ARM pass throughs), ABS, and CMBS sectors. The U.S. Aggregate Index is a component of the U.S. Universal Index in its entirety.
FTSE WGBI Non-USD: The FTSE World Government Bond Index (WGBI) measures the performance of fixed-rate, local currency, investment-grade sovereign bonds. The WGBI is a widely used benchmark that currently includes sovereign debt from over 20 countries, denominated in a variety of currencies, and has more than 30 years of history available. The Non-USD index measures the performance of the markets outside of the US.
MSCI EM Index: The MSCI Emerging Markets Index captures large and mid cap representation across 23 Emerging Markets (EM) countries. With 822 constituents, the index covers approximately 85% of the free float-adjusted market capitalization in each country
MSCI EAFE Index: The MSCI EAFE Index is recognized as the pre-eminent benchmark in the United States to measure international equity performance. It comprises the MSCI country indices that represent developed markets outside of North America: Europe, Australasia and the Far East.
MSCI Frontier Markets Index: Captures large and mid cap representation across 29 Frontier Markets (FM) countries.
Russell 1000 Growth Index (R1000 Growth): Measures the performance of the Russell 1000 companies with higher price-to-book ratios and higher forecasted growth values.
Russell 1000 Index (Russell 1000): Measures the performance of the 1,000 largest companies in the Russell 3000 Index. Frank Russell Co. ranks the US common stocks from largest to smallest market capitalization at each annual reconstitution period. The Russell 1000 Index represents the vast majority of the total market capitalization of the Russell 3000 Index. It is considered to be generally representative of US Equity Large Cap performance.
Russell 1000 Value Index (R1000 Value): Measures the performance of the Russell 1000 companies with lower price-to-book ratios and lower forecasted growth values.
8392442.1
