
Asset Management
Why This Midterm Election Season Feels Different
September 22, 2026
With midterm elections approaching in November, you may start hearing more about the so-called “midterm effect” — one of Wall Street’s most-watched seasonal patterns.
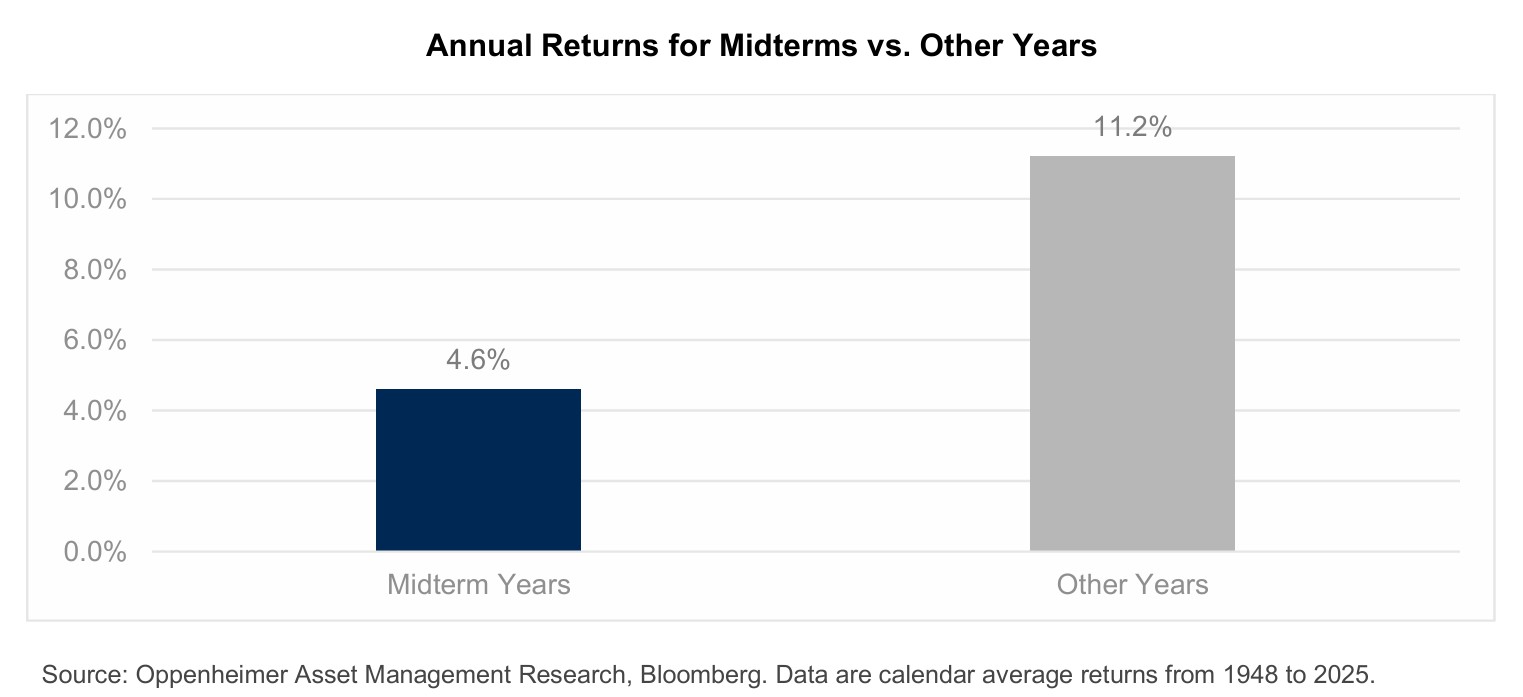
Since 1948, years featuring a U.S. midterm election have produced an average annual gain of 4.6% for the S&P 500, compared with an average gain of 11.2% during the other three years of the presidential cycle. The reasoning is intuitive: the party controlling the White House often loses Congressional seats in midterms, creating uncertainty around taxes, spending priorities, and regulation — and markets tend to dislike uncertainty.
That average also tends to come with more turbulence along the way. Market volatility has historically tended to build through the late summer and fall of midterm years, running above what’s typical in ordinary years, before easing once results are known. Rising volatility is not the same thing as falling markets — it measures how much prices move, not which direction.
2026 has already demonstrated the point on both counts. Monthly returns this year have looked nothing like a typical midterm year, and other forces — including the conflict with Iran and the resulting energy price shock — appear to have overshadowed election-related uncertainty entirely.
So why bring any of this up? Because knowing a period has historically been noisier is useful preparation — the difference between being surprised by turbulence and expecting it. The practical risk in a season like this isn’t the volatility itself; it’s the decisions volatility tempts people into: selling into weakness, sitting in cash “until things settle down,” then re-entering after the recovery has already happened.
For additional insights on the upcoming midterm elections and potential market implications from Oppenheimer's Chief Investment Officer, click here to read.
This material is provided for informational purposes only and is not a recommendation as defined in Regulation Best Interest adopted by the U.S. Securities and Exchange Commission. It does not constitute a recommendation to buy or sell any security or to adopt any investment strategy. The views expressed are those of the author and may not reflect the views of Oppenheimer & Co. Inc. or its affiliates.
The S&P 500 Index is an unmanaged, capitalization-weighted index of 500 leading U.S. large-cap companies. It is not possible to invest directly in an index. Index performance is shown for illustrative purposes only, assumes reinvestment of dividends, and does not reflect fees, expenses, or taxes.
Historical market patterns, returns, and correlations discussed herein are for illustrative purposes only and may not be indicative of future results. Observed relationships between market performance and election cycles are based on historical correlations and do not imply causation. Past performance does not guarantee future results.
Investing in securities involves risk, including the possible loss of principal. There is no assurance that any investment strategy will be successful.
Oppenheimer & Co. Inc. is a registered broker-dealer and investment adviser and an indirect wholly owned subsidiary of Oppenheimer Holdings Inc. Member SIPC. 9099130.1
