Big Tech Drives Disparity Between Growth and Value
- July 29, 2020
A look at performance and concentration across styles and sectors.
The stock market has staged a spirited rally in recent weeks but remains highly volatile as uncertainty regarding future Covid-19 outbreaks persist. Generally speaking, growth stocks have outperformed value stocks in recent months. But the rebound has been anything but broad-based. In fact, tech and momentum stocks have been shouldering the load. And within tech, a handful of companies are delivering a bulk of the returns. Essentially, market breadth is weak. That sets the stage for active managers to generate alpha outside of a small group of mega-cap stocks and a potential resurgence in value stocks.
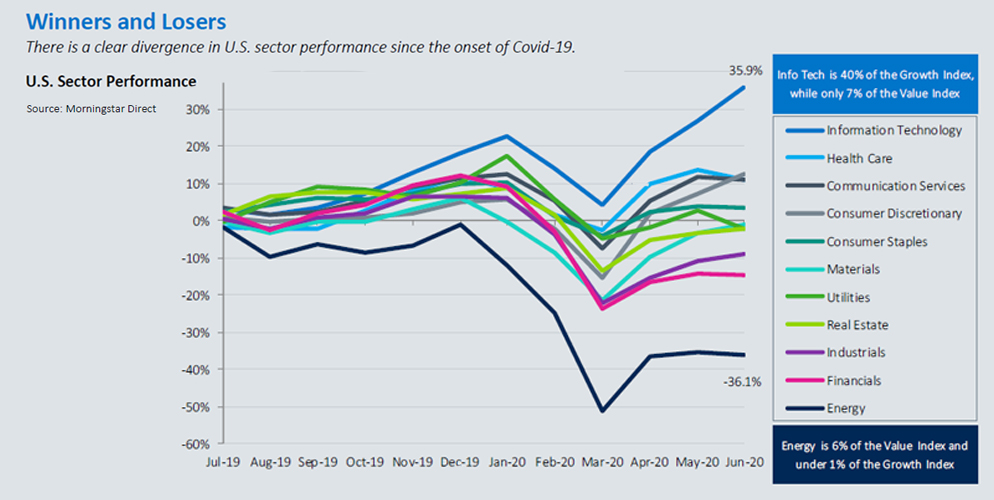
Since the onset of the outbreak, there are clear winners and losers. There has been a significant divergence in S&P 500 Index sector returns over the trailing 12 months. The disparity in sector performance coupled with substantially different index sector weights had a profound impact on the returns of large-cap growth and large-cap value indices. Information technology has vastly outperformed other sectors, which has been a tailwind for the growth index. Meanwhile, value-oriented sectors, such as energy and financials, have been recent underperformers. These weighting disparities have been significant headwinds for the value index relative growth. However, the underperformance of value stocks could provide a tailwind for outperformance if they rebound.
A few mega-cap stocks are driving performance of cap-weighted growth indices. In addition to diverging sector performance, the same has been true with individual stocks in the indices that have large allocations in market-cap weighted indices. Six mega-cap stocks, Facebook, Apple, Amazon, Netflix, Google (Alphabet) and Microsoft (FAANGM), have been leading the way in recent years, while the majority of stocks in the index have lagged. An equally weighted basket of those six stocks has easily outperformed the broader market over the trailing 12 months, providing a significant boost to the Russell 1000 Growth Index.
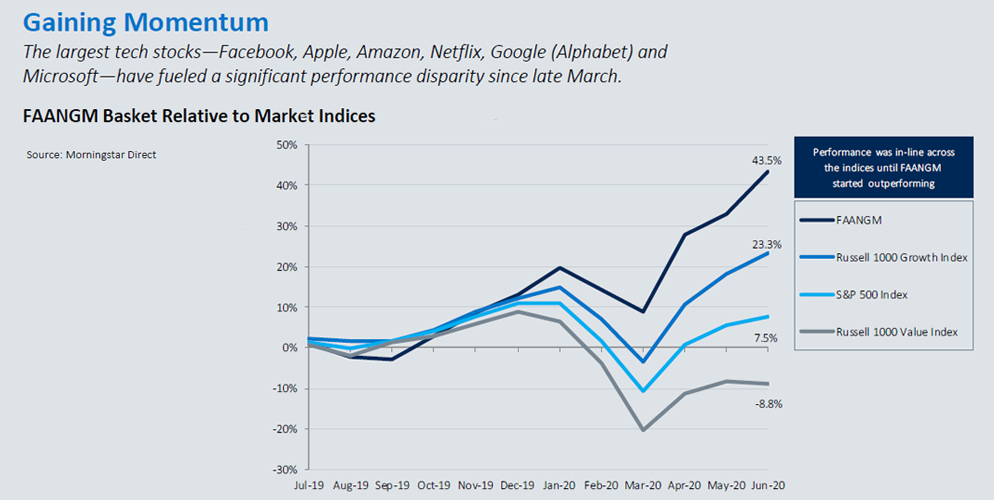
FAANGM stocks contributed over 100% of S&P 500 returns in the last year. Over the trailing 12 months, FAANGM contributed 8.1% to the S&P 500’s total return, which implies they were responsible for over 100% of the index’s performance. When looking at the Russell 1000 Growth Index, those six stocks contributed 14.4%, 61% of its trailing 12-month return. The strong performance of FAANGM has boosted the indices higher and masked how weak market breadth has become.
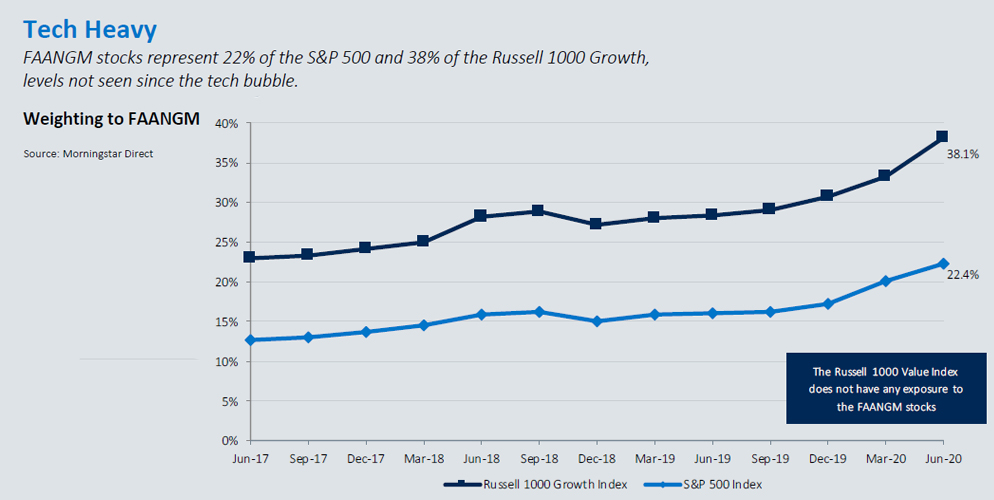
FAANGM stock weightings in growth indices rival tech bubble levels. The strong FAANGM performance has led to significant weightings in those market-cap based indices. Combined, FAANGM stocks now represent 22% of the S&P 500 Index and 38% of the Russell 1000 Growth, levels not seen since the tech bubble.
Large-cap momentum stocks may continue to drive index performance. The increased concentration to these stocks has been a tailwind for the growth index in recent years as these stocks have continued to outperform. Looking forward, the index may be even more reliant on that positive momentum because these six stocks have become such large allocations and will be a larger driver of performance, positive or negative, in the future.
Active management may be poised to outperform. Mega-cap tech stocks have become such large allocations in growth indices that market performance may be more closely tied to a handful of stocks. That heavy concentration could pose a risk for the index if they start to underperform. Investors may want to consider actively managed strategies that can allocate capital to the most attractive opportunities, rather than follow a mandate to overweight stocks with the largest market caps.
DISCLOSURE
This material is not a recommendation as defined in Regulation Best Interest adopted by the Securities and Exchange Commission. It is provided to you after you have received Form CRS, Regulation Best Interest disclosure and other materials.
This material is intended for informational purposes only. The information and statistical data contained herein have been obtained from sources we believe to be reliable. Oppenheimer Investment Advisers (OIA) is a division of Oppenheimer Asset Management Inc. Oppenheimer Investment Management is a subsidiary of Oppenheimer Asset Management. The opinions expressed are those of Oppenheimer Asset Management Inc.(“OAM”) and its affiliates and are subject to change without notice. No part of this material may be reproduced in any manner without the written permission of OAM or any of its affiliates. Any securities discussed should not be construed as a recommendation to buy or sell and there is no guarantee that these securities will be held for a client’s account nor should it be assumed that they were or will be profitable. Securities referenced herein are used as proxies or illustrations of broader market or sector principles. Past performance does not guarantee future comparable results.
All securities investing entails some risk of loss of principal. There is no guarantee the recommended strategy will be successful. Oppenheimer Asset Management is the name under which Oppenheimer Asset Management Inc. (OAM) does business. OAM is a registered investment adviser. A strategy's performance may be affected by general economic and market conditions, such as interest rates, inflation rates, economic uncertainty, changes in laws, and national and international political circumstances. The information provided herein should not be construed as a recommendation to buy, sell, or hold any particular security. Opinions expressed herein are current as of the date appearing in this material.
OAM is a wholly owned subsidiary of Oppenheimer Holdings Inc. which also wholly owns Oppenheimer & Co. Inc. (“Oppenheimer”), a registered broker/dealer and investment adviser. Securities are offered through Oppenheimer and will not be insured by the FDIC or other similar deposit insurance, will not be deposits or other obligations of Oppenheimer or guaranteed by any bank or other financial institution, will not be endorsed or guaranteed by Oppenheimer and will be subject to investment risks, including the possible loss of principal invested. 3138502.1