How to Navigate Economic Data Turbulence
- May 14, 2020
The coronavirus outbreak is beginning to drive key measures of economic health toward recession levels, as government-mandated shutdowns are skewing the numbers dramatically. Here’s a primer on the most relevant economic releases to watch, how to make sense of the numbers and what they portend for financial markets.
The health of the U.S. economy is taking a huge hit from the coronavirus outbreak. The fallout will be felt in the coming months as key economic measures are expected to reveal the ill effects of a temporary shutdown of non-essential businesses, forced furloughs, a remote work force and stringent travel restrictions. We believe the rapid reversal from economic expansion to contraction will be unprecedented in the post-World War II era.
However, it’s important to note that the jarring numbers we expect to see do not reflect the true long-term health of the economy. Rather, they represent the tradeoffs and financial sacrifices we must make as a nation when implementing social distancing practices and lockdowns to curb contagion. In other words, the policy response to the outbreak creates anomalies in the data that look alarming but really just mask seemingly healthy economic conditions that, in our view, will resume after the pandemic.
Meanwhile, the depth of the impact of our Covid-19 response will take time to surface in economic data. Some data sets will reveal it sooner than others. Why? Many economic releases are lagging indicators—snapshots of a specific period that is a month or several months in the past—so they may not capture the full lockdown period until after the peak of contagion in the United States. Other data are more timely measures. Each economic report is just one piece of the puzzle.
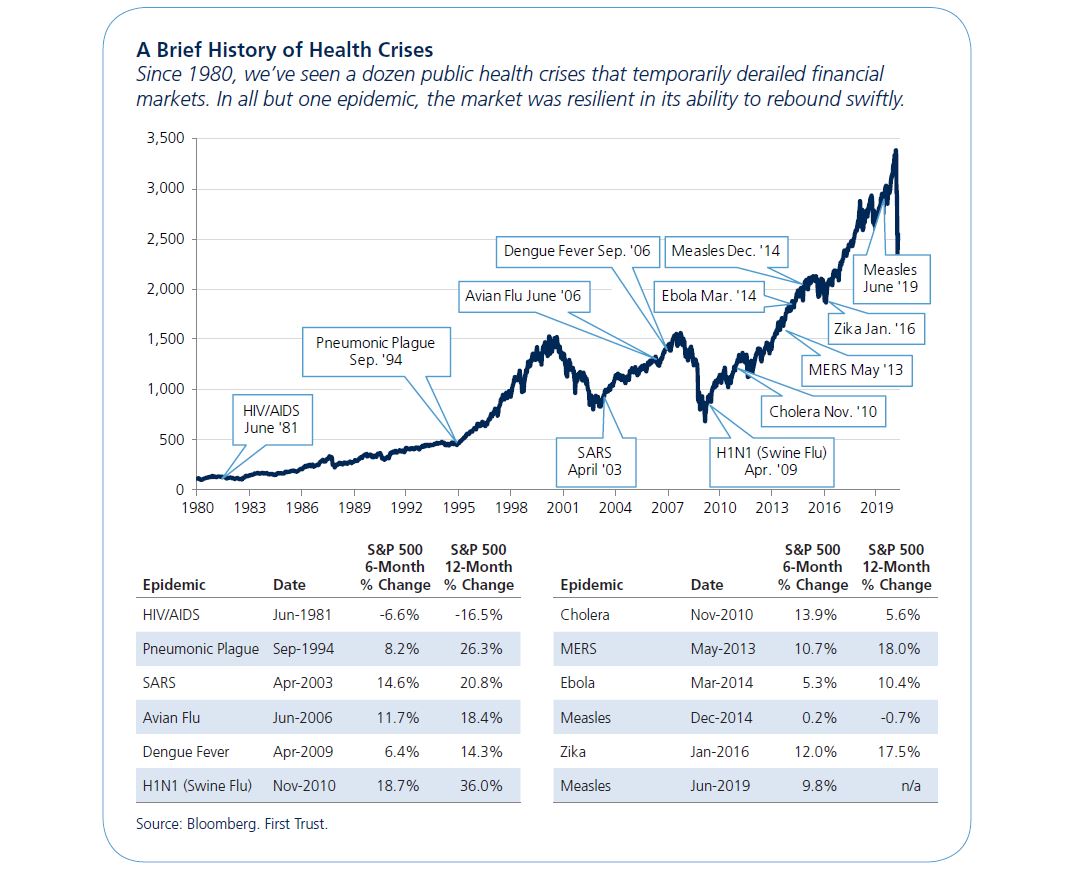
Still, even though the numbers may mirror a steep cyclical recession, investors should maintain a long-term view. Historically, public health crises and black-swan events have been relatively short-lived. We believe the U.S. economic engine will fire on all cylinders once Covid-19 containment has been reached. While the timeline remains uncertain, we expect U.S. macro fundamentals to rebound as furiously as they’re currently declining.

In the coming months, we will be closely monitoring the most telling economic signals and sharing our analysis on what they mean for investors when we see meaningful developments. Here is a quick primer on the U.S. economy’s vital signs through the lens of five key economic reports:
1. Employment Report
The employment report, which includes the household survey and the establishment survey, is one of the most telling and timely measures of the economy’s overall health. It contains a wealth of data on the labor market but the most notable statistics are the unemployment rate, nonfarm payrolls, average hourly earnings, average work week and the labor force participation rate. The Federal Reserve places great emphasis on nonfarm payrolls when formulating its economic projections and policy actions. One of the key differences between the two surveys is that the establishment survey shows job losses and layoffs when recessionary conditions take hold, while the household survey shows gains as displaced workers move into more marginal employment captured by that survey.
Frequency: First or second Friday of the month.
Market impact: High.
Why it matters: Job gains indicate that businesses are actively hiring and growing their operations. Newly employed workers earn more and have higher disposable income, which can boost consumer spending and, ultimately, drive corporate profits and economic expansion.

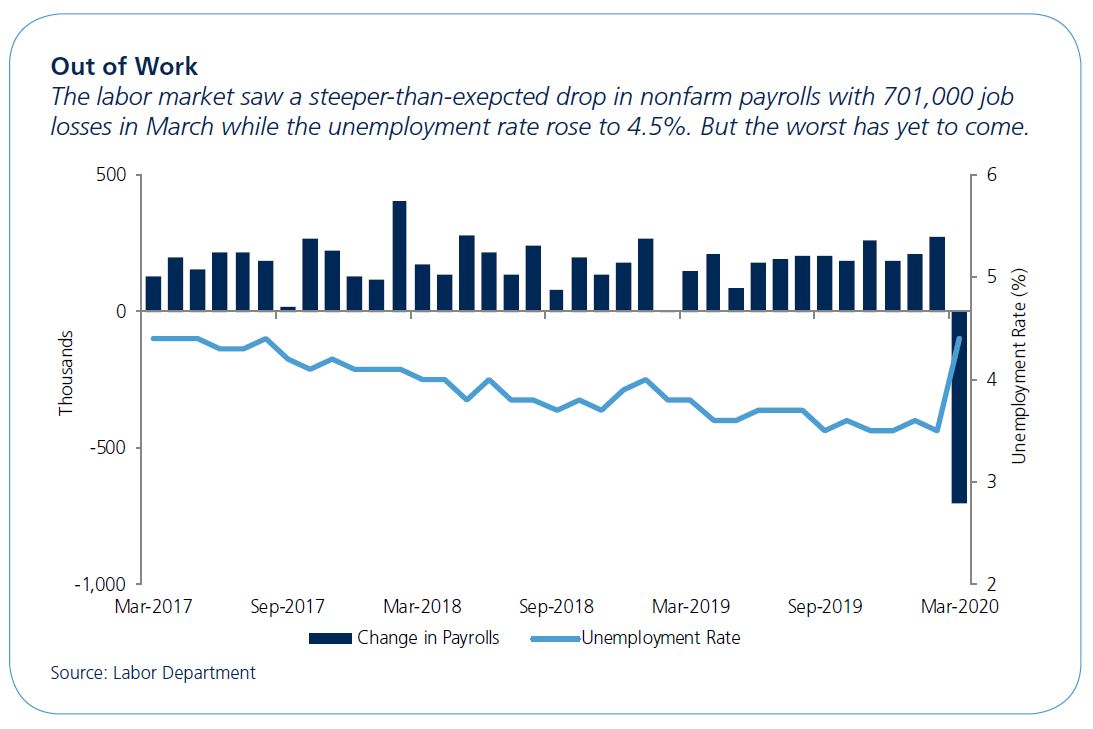
What’s the latest?: The March report showed 701,000 jobs lost and a rise in unemployment to 4.4% from 3.5% in the prior month. The timing of the survey, however, masked the likely volatility in the full month because it was conducted during the week that included March 12—when social distancing first was strongly encouraged in New York—and many restaurants remained open for dining in until March 16. Other areas of the country didn’t shut down restaurants and other businesses until the following week. We expect to see more of the full impact of nationwide lockdowns on job losses when the April report is released on May 8.
The bottom line: Job losses will be steep in the coming months. Look for the inflection point when layoffs peak. The big questions are how will government stimulus create jobs and which sectors will lead the job recovery once the virus has been contained.
2. ISM Manufacturing and Non-Manufacturing
The Institute for Supply Management (ISM) conducts a monthly survey of purchasing and supply executives from roughly 800 U.S. entities, including private firms, school districts and government agencies. The ISM manufacturing index is the bellwether gauge for factory activity in America, as it reports hard data as opposed to anecdotal evidence and has one of the shortest reporting lags among economic releases.
The non-manufacturing survey covers service industries such as lodging, food, real estate, wholesale trade, education, arts and entertainment as well as mining, construction, agriculture and fisheries. It covers a much larger number of firms and its results are weighted by each industry’s contribution to GDP. Each data set is rolled up into a Purchasing Managers Index, or PMI, a composite that puts the smaller data sets into an indicator that is easy to understand at a glance. Readings over 50 in the PMI signal economic expansion while readings below 50 point to contraction.
Frequency: First and third business day of each month.
Market impact: High.
Why are they important? The surveys give us as close to a real-time picture of what’s going on with the nation’s supply lines and demand for goods and services. They provide a comprehensive look at the strength of new orders, production, employment, inventories, prices and backlogs. For several months, the manufacturing survey has been showing supply-chain bottlenecks related to items imported from overseas suppliers that faced Covid-19 disruptions.
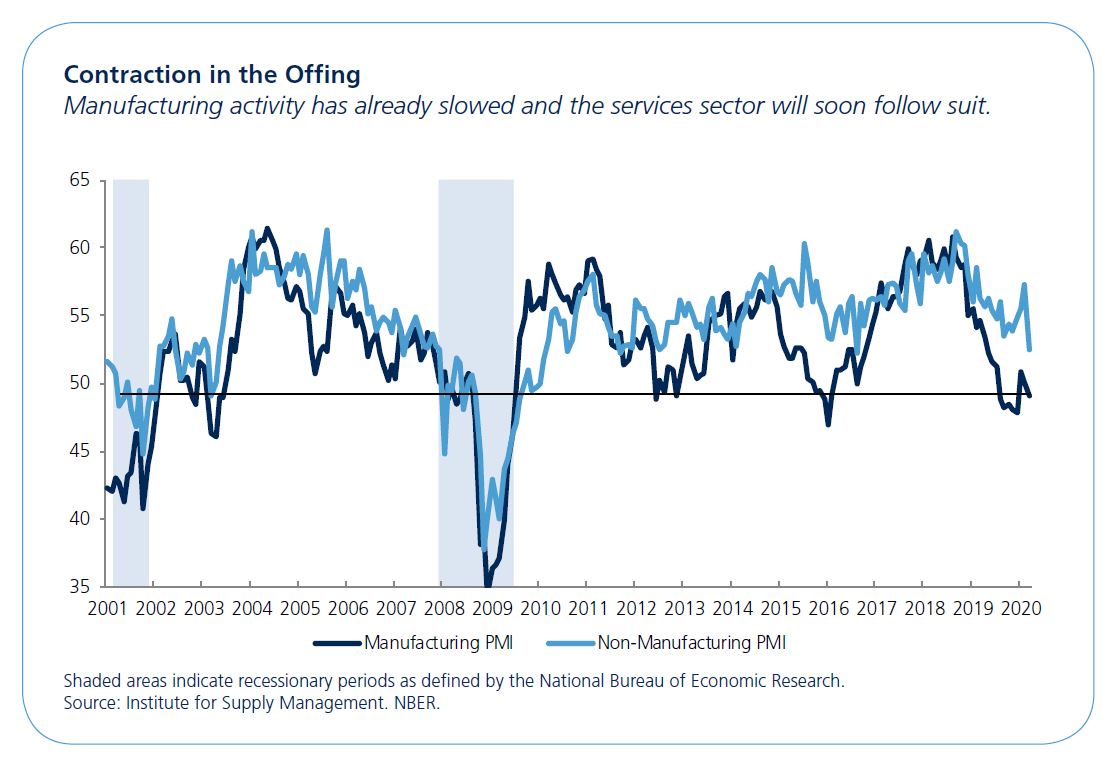

What’s the latest?: The manufacturing index slid to 49.1 in March from 50.1 in February, outpacing the consensus estimate of 44.5. The non-manufacturing index fell to 52.5 in March from 57.3 in the prior month versus a consensus estimate for a deeper slide to 44.5. Many purchasing managers surveyed had returned their results well before the lockdowns began.
The bottom line: This report can help investors gauge inflection points for industries when the nation turns the corner on the pandemic; it may also help signal the shape of the recovery for various industries. When American workers return and firms restart production and hiring these reports can signal which industries and sectors are recovering fastest and can give us a helpful indication of the strength of new orders, production and whether activity is being constrained by supply bottlenecks. Look for both indexes to drop well below 50 (the inflection point between expansion and contraction) when the April ISM reports are released on May 1 and May 5, respectively.
3. Retail Sales
The U.S. Census Bureau mails forms to 13,000 retail firms, including online stores, which report sales, inventories and other data. The survey includes restaurants, gas stations, car dealerships and services such as dry cleaners, auto repair shops and landscapers. The data is then organized to give an advance estimate of the results nine business days after the end of the month. The advance report estimate provides a snapshot of sales to final consumers in the prior month and is closely watched by the Fed, the Commerce Department and other agencies that assess consumer demand. More detailed results are released in a separate report on the same day as the next month’s advance estimates.
Frequency: Ninth business day of the month.
Market impact: High.
Why is it important? The relatively quick releases give us an overview of sales revenue across a wide range of industries within the retail sector. To glean more color from nominal sales figures, economists often look at sales excluding gas stations (gas prices are volatile and can skew the figures) and excluding auto sales (discounting and rebates can skew the figures.) The data are used to calculate early GDP estimates. Since the consumer makes up about 70% of GDP, retail sales are critical to assessing how quickly the economy is growing or contracting.

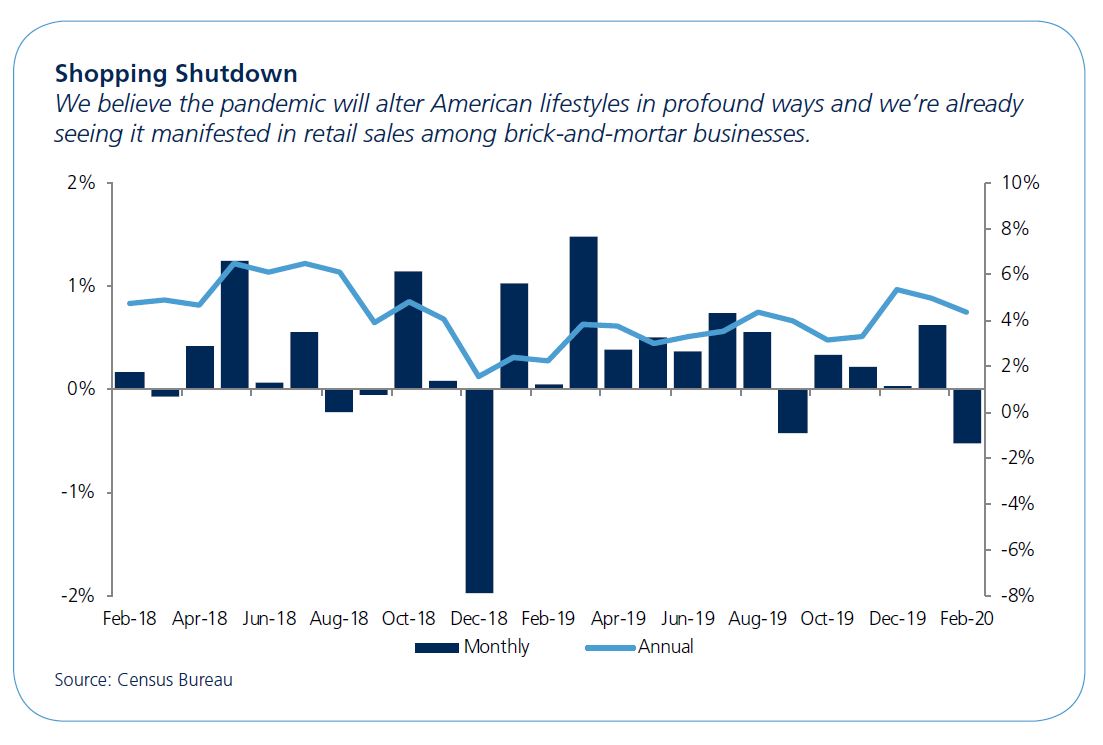
What’s the latest?: The March advance retail sales report is scheduled for release on April 15. We expect the report to show a steep drop in March sales, as many businesses closed during the month. The advance report on April sales, slated for release on May 15, is likely to be much worse because most brick-and-mortar retail outlets have been closed for most of the month.
The bottom line: The pandemic is likely to alter consumer and family lifestyles in profound ways, both temporary and permanent. Consumption patterns are unlikely to return immediately to pre-crisis norms. Will consumers return to restaurants, ballparks and arenas immediately or will they continue to seek entertainment and meals at home? This report can help investors identify thematic investment ideas as well as companies that are likely to gain market share.
4. Leading Economic Indicators
The Conference Board, a non-profit think tank of approximately 1,200 public and private member organizations, publishes three composite average indexes—leading, coincident and lagging—each month. The indices reveal common “turning point patterns” in economic data in a clearer and more convincing way than any individual component, primarily because they smooth out the volatility of individual components.
Here are the 10 leading indicators:
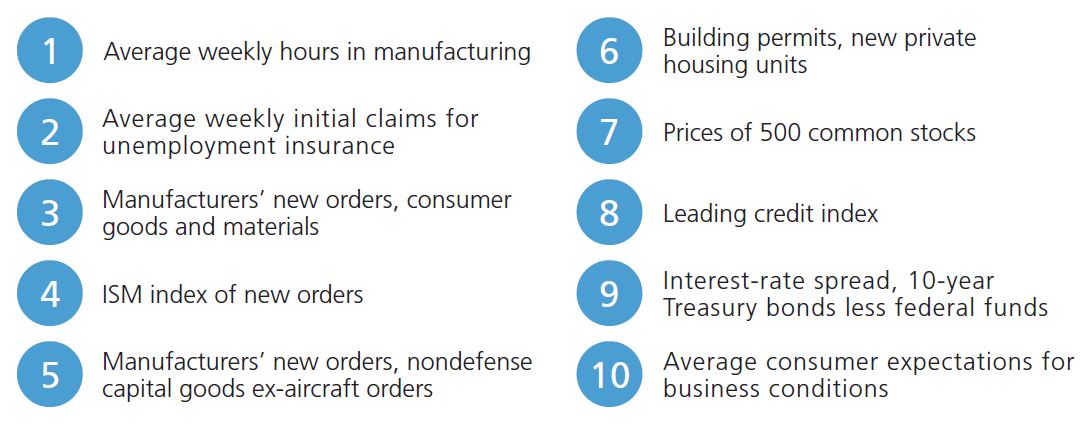

Why is it important? Leading indicators help identify inflection points in the business cycle, making it the most comprehensive and predictive economic release.

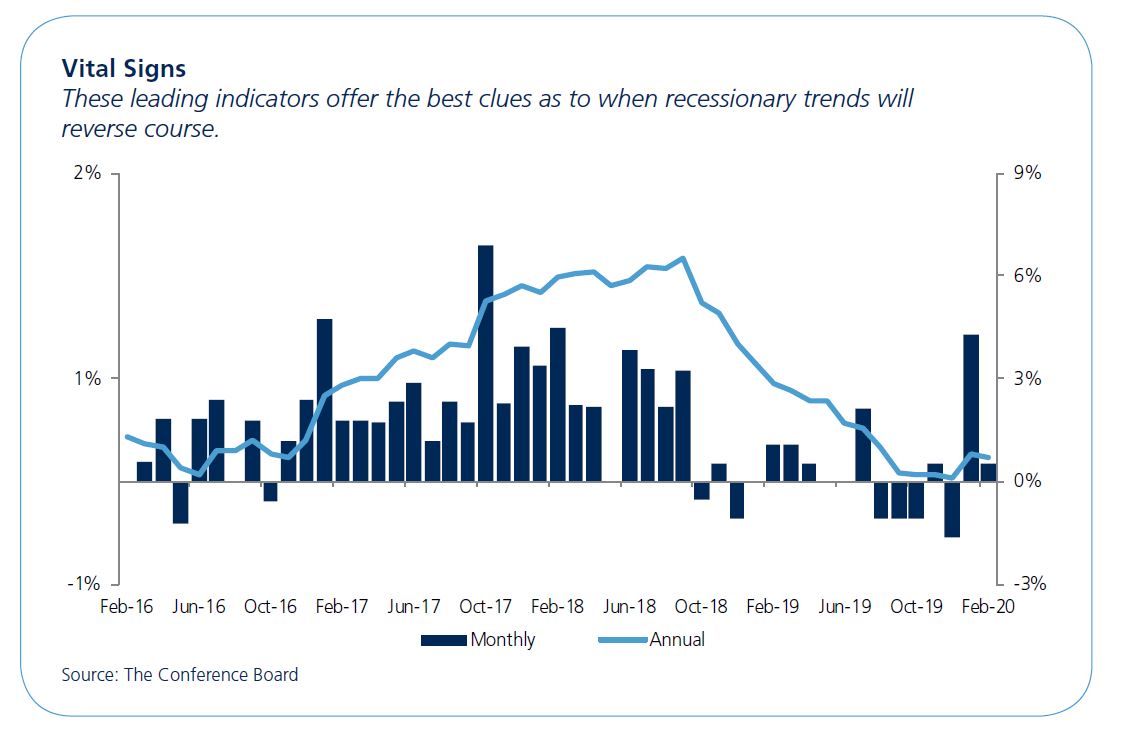
What’s the latest?: The February report showed a modest uptick. The March report, due out on April 17, is likely to show a steep decline, but the April LEI, due on May 17, will likely be far worse. We expect the leading indicators to signal a recession.
The bottom line: It may be several months before the economy reaches its inflection point and begins to grow again. These leading indicators are useful signposts for the turn of the tide but also in determining the shape of the recovery (V-shaped, U-shaped, Nike Swoosh.)
5. Consumer Sentiment
The University of Michigan and the Conference Board conduct the two most widely followed surveys of consumer sentiment. The Michigan survey poses five questions about current financial prospects compared to a year ago. The questions help gain insight into respondents’ views about their financial situation as well as their expectations for the nation:
- Household financial conditions today compared to a year ago
- Expectations for household financial prospects in the next year
- View of business conditions for the United States over the next 12 months
- Prospects for the nation over the next five years
- Likelihood to purchase big-ticket items—cars, appliances and furniture
The Conference Board survey is conducted by Nielsen, which measures what consumers buy and watch on television. It is mailed to a random sample of consumers from all regions and across various demographic types based on age, gender and geographic location.
Frequency: Preliminary numbers for the Michigan survey are published early in the month followed by a final estimate near the end of the month. The Conference Board releases data at the end of the month.
Market impact: High.
Why are they important? The surveys give insight into how consumers are feeling about their prospects in the current moment and about their future prospects. Since final consumption spending makes up 70% of GDP, the general outlook of consumers can indicate whether they’re feeling up to, for example, extending their credit to finance a major purchase or saving for tougher times ahead.
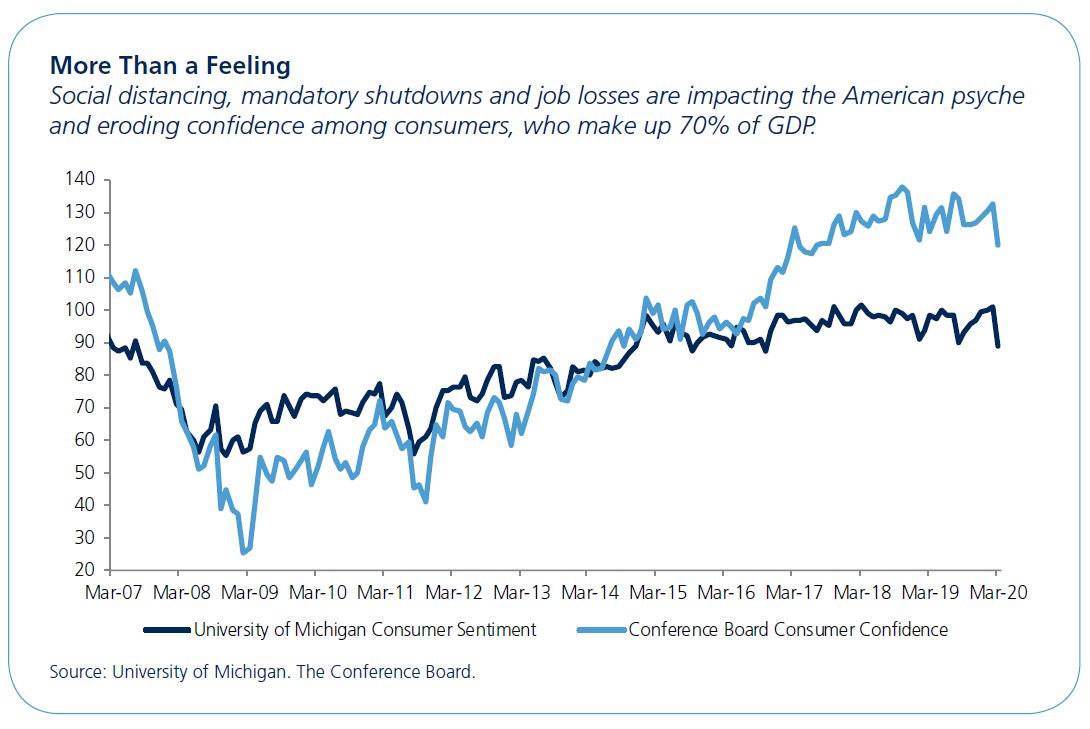

What’s the latest?: The Michigan survey for March was conducted between Feb. 26 and March 24 with preliminary results released on March 13 (for information received through March 11) that showed a decline to 95.9 from February’s 101 The final result for March showed a further decline to 89.The April survey will be conducted from Mar. 25 to April 20 with a preliminary result released on April 9 and final results on April 24. These are likely to show historically deep declines.
The Conference Board released its poll on March 31. The survey showed a decline to 120 from 132.6 in the prior month. The cutoff date for the survey was March 19, which was four days after the lockdown in New York. The April release, set for April 28, is likely to show a much deeper decline as more states and municipalities closed for the April sample period.
The bottom line: Insight into consumer views after a massive global crisis can help signal future profitability of industries and sectors. Knowing when Americans are feeling better about major purchasing decisions can be useful not only for durable goods industries but also for the financial sector.
Disclosure
© 2020 All rights reserved. This report is intended for informational purposes only.
All information provided and opinions expressed are subject to change without notice. The information and statistical data contained herein have been obtained from sources we believe to be reliable. No part of this report may be reproduced in any manner without the written permission of Oppenheimer Asset Management or any of its affiliates. Any securities discussed should not be construed as a recommendation to buy or sell and there is no guarantee that these securities will be held for a client’s account nor should it be assumed that they were or will be profitable. Oppenheimer Asset Management is the name under which Oppenheimer Asset Management Inc. (“OAM”) does business. OAM is an indirect, wholly owned subsidiary of Oppenheimer Holdings Inc., which is also the indirect parent of Oppenheimer & Co. Inc. (“Oppenheimer”). Oppenheimer is a registered investment adviser and broker dealer. Securities are offered through Oppenheimer.
Investing in securities entails risk and may result in loss of principal. Past performance does not guarantee future results. Indices are unmanaged, hypothetical portfolios of securities that are often used as a benchmark in evaluating the relative performance of a particular investment. An index should only be compared with a mandate that has a similar investment objective. An index is not available for direct investment, and does not reflect any of the costs associated with buying and selling individual securities or management fees. The information provided herein should not be construed as a recommendation to buy, sell, or hold any particular security. Opinions expressed herein are current as of the date appearing in this material. Some of the information in this document may contain projections or other forward looking statements regarding future events or future financial performance of Funds, countries, markets or companies. Actual events or results may differ materially. 3035600.1