Merger Arb Boosts Diversification
- March 21, 2022
An attractive asset class amid rising inflation and interest rates
Traditional balanced portfolios of 60% stocks and 40% bonds have delivered attractive performance and diversification over the last two decades, driven by the negative correlation between stocks and bonds. However, the negative correlation of these two major asset classes hasn’t persisted throughout history and it’s possible that we could be entering a period of positive stock-bond correlation.
Historically, stock-bond correlations have differed based on the inflationary backdrop. During periods of relatively low inflation, reflected as Core CPI under 2.5%, the negative relationship between stocks and bonds has remained intact. But during periods of elevated inflation—such as 1966-1999—this trend reversed, resulting in a positive correlation between the asset classes.
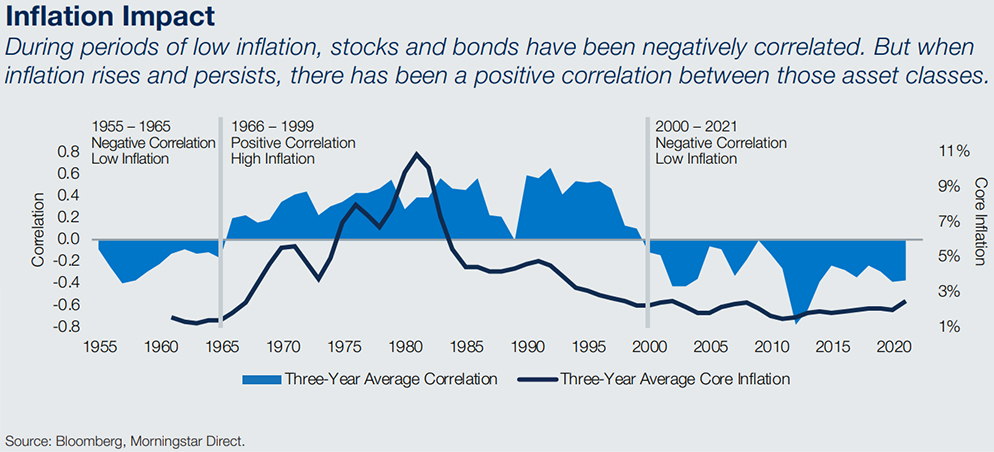
Inflation has notably picked up in the wake of the Covid-19 pandemic. After the U.S. economy reopened, prices began rising in the spring of 2021 as businesses dealt with labor shortages and supply chain issues. Additionally, you have the base effect of comparing prices to a period when the economy was shut down. But while the Federal Reserve and many experts expected inflation to be transitory, higher prices have instead persisted. In fact, the core CPI year-overyear increase of 6% was the largest spike since 1982. While inflation may soften a bit later this year as supply chain pressures ease, it may be prudent for investors to consider protection for their portfolios as inflation is still expected to remain elevated.
Higher inflation often coincides with higher interest rates. Historically, conventional fixed-income strategies have confronted headwinds during periods of rising interest rates. During rising-rate environments, bond prices fall as interest rates rise, creating challenges for the traditional 60/40 portfolio. While equities, particularly value stocks, tend to exhibit more resilience in a rising-rate environment, an allocation to merger arbitrage strategies can offer upside potential as well as diversification benefits.
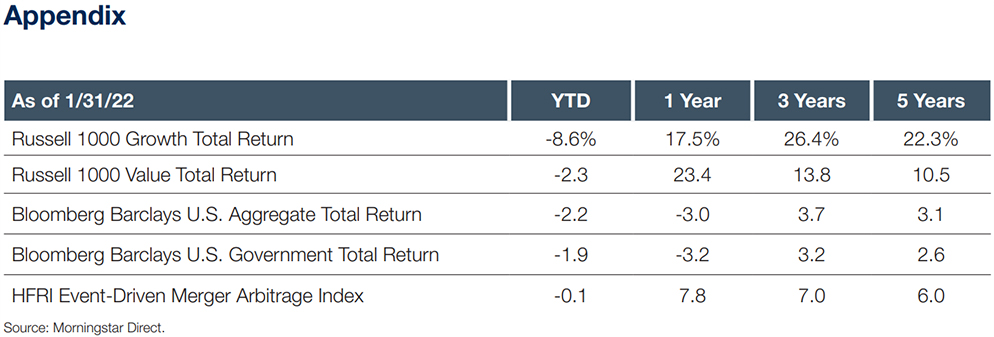
This relationship has been on display over the last year and a half. Between August 2020 and January 2022, the 10-year U.S. Treasury yield increased by 1.23% to 1.79% from 0.56%. Over this period, the Bloomberg Barclays US Aggregate Index and the Bloomberg Barclays US Government Index generated negative returns while the HFRI ED Merger Arbitrage Index yielded positive returns. Merger arbitrage strategies have also delivered attractive relative performance during some recent periods of volatility in interest rates and equity markets. In September 2021 and January 2022, returns for the HFRI ED Merger Arbitrage Index were roughly flat while both equities and fixed income suffered meaningful declines stemming from sharp rises in interest rates.

While fixed income faces a headwind from rising interest rates, various alternative strategies may actually benefit from higher rates. Higher interest rates have historically led to better returns for spread-related investments like merger arbitrage because as the risk-free rate increases, investors require a larger premium to assume the merger risk. Merger arbitrage funds depend on having an abundance of M&A events to invest in and the number of these events can vary significantly depending on the market environment. In addition, investors should be aware that the risk/return profile of a merger arbitrage strategy is relatively asymmetric, which means there is typically a larger downside in the case of a deal’s failure than the upside offered when a deal succeeds.
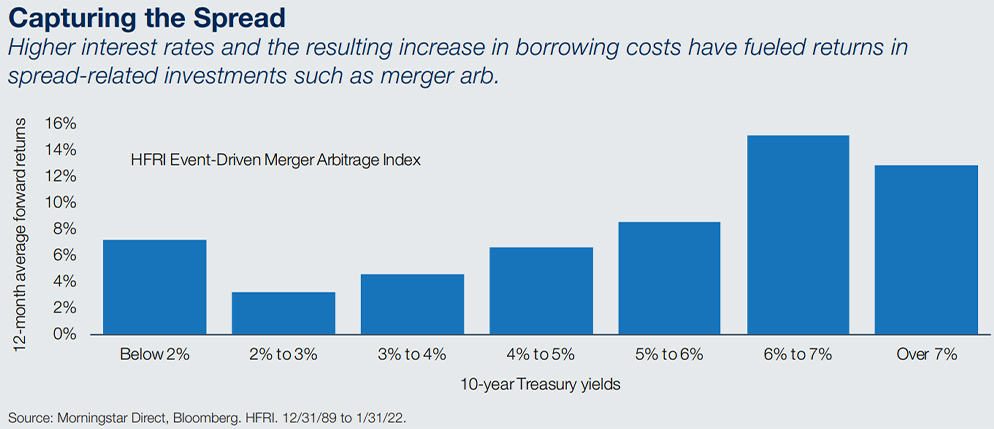
Historically, performance for the HFRI Event-Driven Merger Arbitrage Index grew stronger as yields increased. As a result, allocating capital to a merger arbitrage manager may provide a portfolio with attractive risk-adjusted returns and diversification benefits from traditional equities and fixed income, especially if interest rates continue to climb (the opposite is true in a declining interest rate environment.) Recognizing these benefits and associated risks, OAM Research has recently increased exposure to merger arbitrage strategies across most of the firm’s discretionary portfolios.
Reach out to your Oppenheimer Financial Professional if you have any questions.
Russell 1000 Value Index measures the performance of the large cap value segment of the US equity universe. It includes those Russell 1000® companies with lower price-to-book ratios and lower expected growth values. The Index is constructed to provide a comprehensive and unbiased barometer for the large-cap value segment. The index is completely reconstituted annually to ensure new and growing equities are included and that the represented companies continue to reflect value characteristics.
Russell 1000 Growth Index measures the performance of the large cap growth segment of the US equity universe. It includes those Russell 1000® companies with higher price-to-book ratios and higher forecasted growth values. The Index is constructed to provide a comprehensive and unbiased barometer for the large-cap growth segment. The index is completely reconstituted annually to ensure new and growing equities are included and that the represented companies continue to reflect growth characteristics.
Bloomberg Barclays Capital U.S. Aggregate Bond Index covers the U.S. dollardenominated, investment-grade, fixed-rate, taxable bond market of SEC-registered securities. All issues in the Aggregate Index are rated Baaa3/BBB-/BBB- or higher (using the middle rating of Moody’s, S&P, and Fitch, respectively) and have at least one year to maturity and have an outstanding par value of at least $250 million.
Bloomberg Barclays Capital U.S. Government Index: The index measures the performance of the U.S. Treasury and U.S. Agency Indices, including Treasuries and U.S. agency debentures. It is a component of the U.S. Government/Credit Index and the U.S. Aggregate Index.
HFRI Event-Driven Merger Arbitrage Index measures strategies that employ an investment process primarily focused on opportunities in equity and equity related instruments of companies that are currently engaged in a corporate transaction. Merger Arbitrage involves primarily announced transactions, typically with limited or no exposure to situations which pre-, post-date or situations in which no formal announcement is expected to occur. Merger arbitrage strategies typically have over 75% of positions in announced transactions over a market cycle.
Disclosure
The opinions expressed herein are subject to change without notice. The information and statistical data contained herein has been obtained from sources we believe to be reliable. Past performance is not a guarantee of future results. The above discussion is for illustrative purposes only and mention of any security should not be construed as a recommendation to buy or sell and may not represent all investment managers or mutual funds bought, sold, or recommended for client’s accounts. There is no guarantee that the above-mentioned investments will be held for a client’s account, nor should it be assumed that they were or will be profitable. OAM Consulting is a division of Oppenheimer Asset Management Inc. (OAM). OAM is an indirect, wholly owned subsidiary of Oppenheimer Holdings Inc., which also indirectly wholly owns Oppenheimer & Co. Inc. (Oppenheimer), a registered broker dealer and investment adviser. Securities are offered through Oppenheimer.
For information about the advisory programs available through OAM and Oppenheimer, please contact your Oppenheimer financial advisor for a copy of each firm’s ADV Part 2A.
Adopting a fee-based account program may not be suitable for all investors; anticipated annual commission costs should be compared to anticipated annual fees.
S&P 500 Index (“SPX”) is a well-known, broad-based stock market unmanaged index which contains only seasoned equity securities. The Fund does not restrict its selection of securities to those comprising the SPX. Performance of the SPX is provided for comparison purposes only. While the Fund’s portfolio may contain some or all of the stocks which comprise the SPX, the Fund does not invest solely in these stocks.
Russell 1000 Value Index measures the performance of the large cap value segment of the US equity universe. It includes those Russell 1000® companies with lower price-to-book ratios and lower expected growth values. The Index is constructed to provide a comprehensive and unbiased barometer for the large-cap value segment. The index is completely reconstituted annually to ensure new and growing equities are included and that the represented companies continue to reflect value characteristics.
Russell 1000 Growth Index measures the performance of the large cap growth segment of the US equity universe. It includes those Russell 1000® companies with higher price-to-book ratios and higher forecasted growth values. The Index is constructed to provide a comprehensive and unbiased barometer for the large-cap growth segment. The index is completely reconstituted annually to ensure new and growing equities are included and that the represented companies continue to reflect growth characteristics.
NASDAQ Composite Index tracks the performance of about 3,000 stocks traded on the Nasdaq exchange. The index is calculated based on market cap weighting.
VIX Index Created by the Chicago Board Options Exchange (CBOE), the Volatility Index, or VIX, is a real-time market index that represents the market's expectation of 30-day forward-looking volatility. Derived from the price inputs of the S&P 500 index options, it provides a measure of market risk and investors' sentiments.
MSCI AC World ex-USA Index captures large- and mid- cap representation across 22 of 23 developed-market countries (excluding the U.S.) and 24 emerging-market countries.
LTM PE Ratio is the last 12-month price-to-earnings ratio.
Indices are unmanaged, do not reflect the costs associated with buying and selling securities and are not available for direct investment.
Risk Factors
The success of an investment program may be affected by general economic and market conditions, such as interest rates, the availability of credit, inflation rates, economic uncertainty, changes in laws and national and international political circumstances. These factors may affect the level and volatility of securities prices and the liquidity of a portfolio’s investments. Unexpected volatility or illiquidity could result in losses. Investing in securities is speculative and entails risk. There can be no assurance that the investment objectives will be achieved or that an investment strategy will be successful.
Special Risks of Foreign Securities
Investments in foreign securities are affected by risk factors generally not thought to be present in the United States. The factors include, but are not limited to, the following: less public information about issuers of foreign securities and less governmental regulation and supervision over the issuance and trading of securities. International investments may involve risk of capital loss from unfavorable fluctuation in currency values, from differences in generally accepted accounting principles or from economic or political instability in other nations.
Special Risks of Small- and Mid-Capitalization Companies
Investments in companies with smaller market capitalization are generally riskier than investments in larger, well established companies. Smaller companies often are more recently formed than larger companies and may have limited product lines, distribution channels and financial and managerial resources. These companies may not be well known to the investing public, may not have significant institutional ownership and may have cyclical, static or moderate growth prospects. There is often less publicly available information about these companies than there is for larger, more established issuers, making it more difficult for the Investment Manager to analyze that value of the company. The equity securities of small- and mid-capitalization companies are often traded over-the-counter or on regional exchanges and may not be traded in the volume typical for securities that are traded on a national securities exchange. Consequently, the investment manager may be required to sell these securities over a longer period of time (and potentially at less favorable prices) than would be the case for securities of larger companies. In addition, the prices of the securities of small- and mid- capitalization companies may be more volatile than those of larger companies.
Special Risks of Fixed Income Securities
For fixed income securities, there is a risk that the price of these securities will go down as interest rates rise. Another risk of fixed income securities is credit risk, which is the risk that an issuer of a bond will not be able to make principal and interest payments on time. Liquidity risk is the risk that you might not be able to buy or sell investments quickly for a price that is close to the true underlying value of the asset. When a bond is said to be liquid, there's generally an active market of investors buying and selling that type of bond.
Fixed income securities markets are subject to many factors, including economic conditions, government regulations, market sentiment, and local and international political events. Further, the market value of fixed-income securities will fluctuate depending on changes in interest rates, currency values and the creditworthiness of the issuer.
High Yield Fixed Income Risk
High yield fixed income securities are considered to be speculative and involve a substantial risk of default. Adverse changes in economic conditions or developments regarding the issuer are more likely to cause price volatility for issuers of high yield debt than would be the case for issuers of higher grade debt securities. In addition, the market for high yield debt may be less attractive than that of higher-grade debt securities.
Special Risks of Master Limited Partnerships
Master limited partnerships are publicly listed securities that trade much like a stock, but they are taxed as partnerships. MLPs are typically concentrated investments in assets such as oil, timber, gold and real estate. The risks of MLPs include concentration risk, illiquidity, and exposure to potential volatility, tax reporting complexity, fiscal policy and market risk. MLPs are not suitable for all investors.
Forward Looking Statements
This presentation may contain forward looking statements or projections. These statements and projections relate to future events or future performance. Forward-looking statements and projections are based on the opinions and estimates of Oppenheimer as of the date of this presentation, and are subject to a variety of risks and uncertainties and other factors, such as economic, political, and public health, that could cause actual events or results to differ materially from those anticipated in the forward-looking statements and projections. 4206767.1